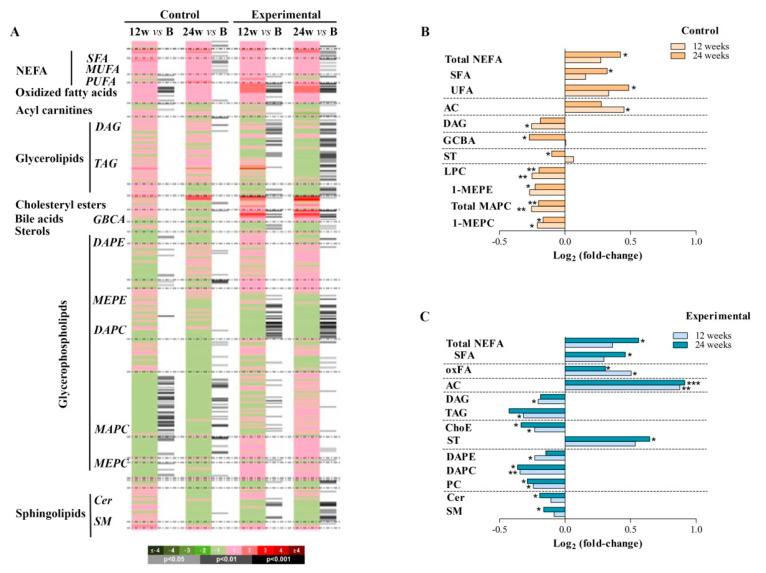
Figure 3.
Effect of EFV and RPV on lipid metabolism. (A) Heatmap representing individual metabolic features obtained from the comparisons between the groups at 12 and 24 weeks after ART randomization. (B, C) Highlighted metabolite changes from the heatmap found at 12 and 24 weeks compared to the corresponding baseline values in patients on EFV (B) and RPV (C) in the ART. Heatmap colour codes for log2 (fold change) and paired Student’s t-test p-values are indicated on the bottom of the figure. Abbreviations: AC, acyl carnitines; B, baseline; Cer, ceramides; ChoE, cholesteryl esters; DAG, diacylglycerol; DAPC, diacylglycerophosphocholine; DAPE, diacylglycerophosphoethanolamine; GCBA, glycine-conjugated bile acid; LPC, lysophosphatidylcholine; MAPC, monoacylglycerophosphocholine; MEPC, monoetherglycerophosphocholine; MEPE, 1-monoetherglycerophosphoethanolamine; MUFA, monounsaturated fatty acid; NEFA, non-esterified fatty acid; oxFA, oxidized fatty acid; PC, phosphatidylcholine; PUFA, polyunsaturated fatty acid; SFA, saturated fatty acid; SM, sphingomyelin; ST, total steroid; TAG, triacylglycerol; UFA, unsaturated fatty acid.

