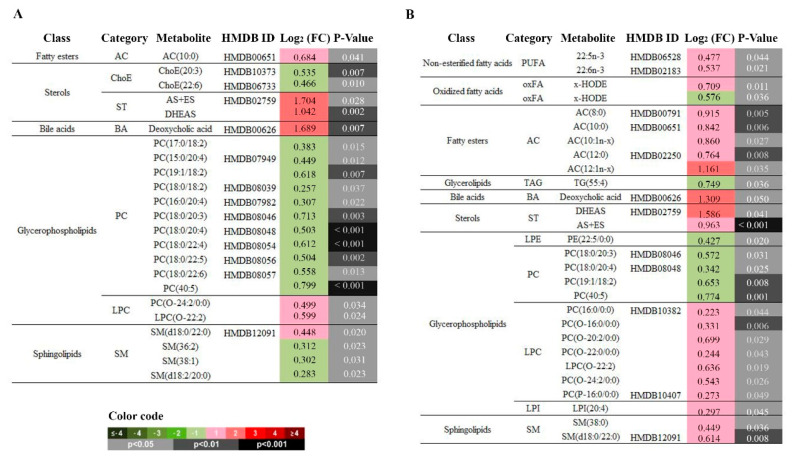
Figure 5.
Impact of switching from EFV to RPV on the lipidomic profile. Relevant lipidomic changes grouped by chemical classes at (A) 12 weeks and at (B) 24 weeks of follow-up. Heatmap colour codes for log2 (fold-change) and unpaired Student’s t-test p-values are indicated at the bottom of the figure. Abbreviations: AC, acyl carnitine; AS+ES (androsterone sulfate + etiocholanolone sulfate); BA, bile acid; Cer, ceramides; ChoE, cholesteryl esters; DAG, diacylglycerol; DHEAS, dehydroepianosterone sulfate; FC, fold change; HMDB, Human Metabolome Database; HODE, hydroxy-octadecadenoic acid; LPC, lysophosphatidylcholine; LPE, lysophosphatidylethanolamine; LPI, lysophosphatidylinositol; oxFA, oxidized fatty acid; PC, phosphatidylcholine; PE, Phosphatidylethanolamine; PUFA, Polyunsaturated fatty acid; SL, storage lipid; SM, sphingomyelin; ST, total steroid; TAG, triacylglycerol.

