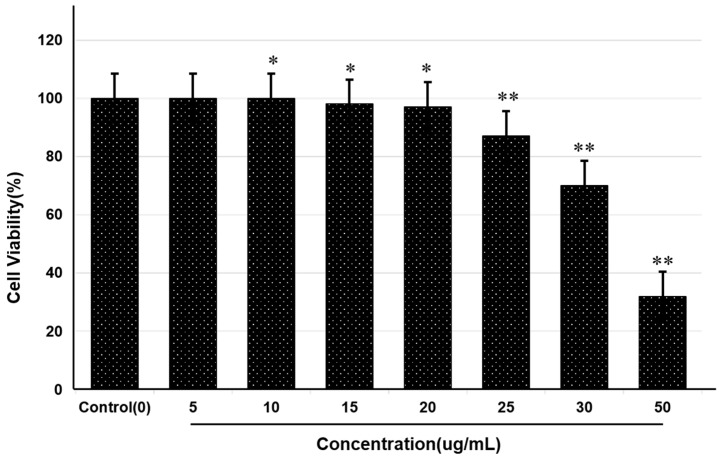
Figure 3.
Toxicity determination of theasaponin E1 on mouse neuroblastoma cells by MTT assay. Percentage cell viability was determined for control and various concentrations of theasaponin E1. Experiments were performed in triplicate. Data are the mean ± SEM. Data are statistically significant at p < 0.05. (* represents significance at p < 0.05, ** represents significance at p < 0.01 to control group).

