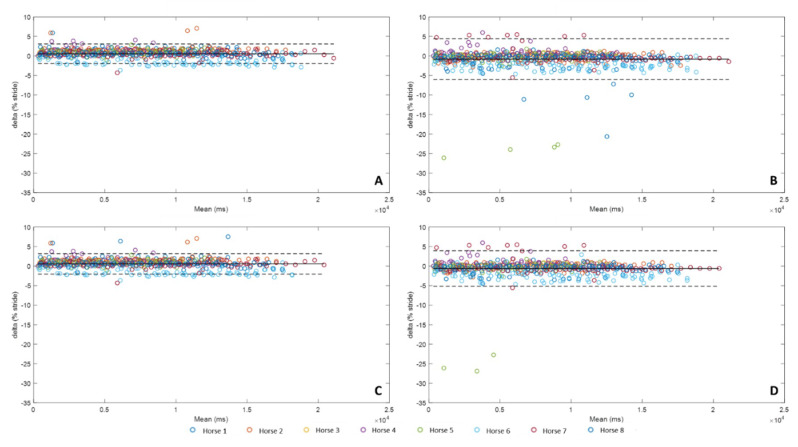
Figure 5.
Bland-Altman comparison of the Foot on detection of the four methods developed with IMU data and MoCap Foot on detection. Accuracy (bias between each method and MoCap) and limits of agreement (95% limits of agreement) of method A were represented on the upper left corner (A), method B on the upper right corner (B), method C on the lower left corner (C), and method D on the lower right corner (D).

