Figure 3.

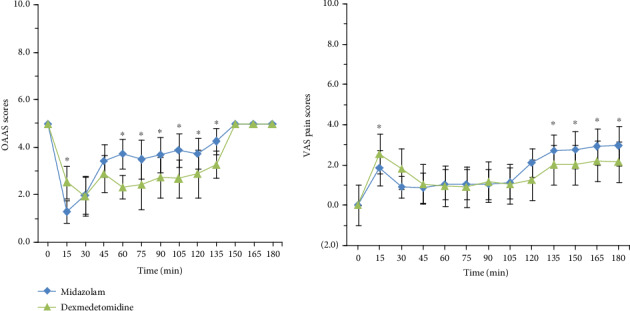
OAAS and VAS pain scores (mean ± SD) for the two treatment groups (group M and group D) during the course of 180 min. Time 0 min is before drug administration. ∗p < 0.05.

OAAS and VAS pain scores (mean ± SD) for the two treatment groups (group M and group D) during the course of 180 min. Time 0 min is before drug administration. ∗p < 0.05.