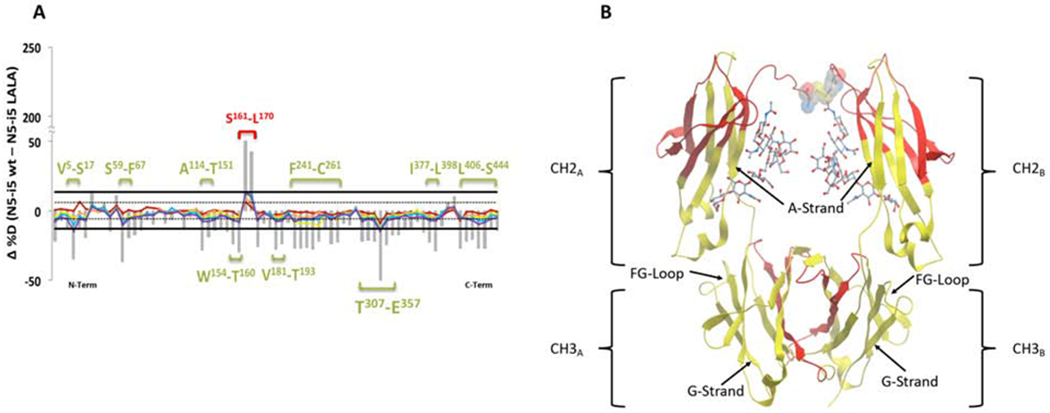
Figure 4-. HDX-MS of N5i5 wild type heavy chain vs N5i5 LALA mutant heavy chain.

Panel A shows the percent difference plots (WT – LALA) in deuterium uptake for the heavy chain. Individual peptidic fragments are plotted on the x-axis going from N to C terminus based on the sequence number of the first residue of the peptide. Color coded traces represent the percent deuterium uptake difference for a given peptide at a given deuterium incubation time point (10 sec red, 1 min orange, 10 min yellow, 1 hr blue, 2 hr purple). The grey bars represent the sum of the percent deuterium uptake differences integrated over all time points and is used only for statistical purposes. 98% confidence intervals are plotted as horizontal lines with solid lines for the sum of differences and hashed lines for individual time points. Regions displaying significant differences are indicated as brackets with sequences indicated. Panel B shows the significant regions mapped onto cartoon representation of onto IgG1 Fc from PDB:1E4K. Rendered in yellow are the regions displaying significant changes in deuterium uptake, here increased uptake in the LALA mutant. L234-L235 are rendered as CPK in the lower hinge and the glycans are rendered as sticks. See also Figure S3.
