
Figure 4.
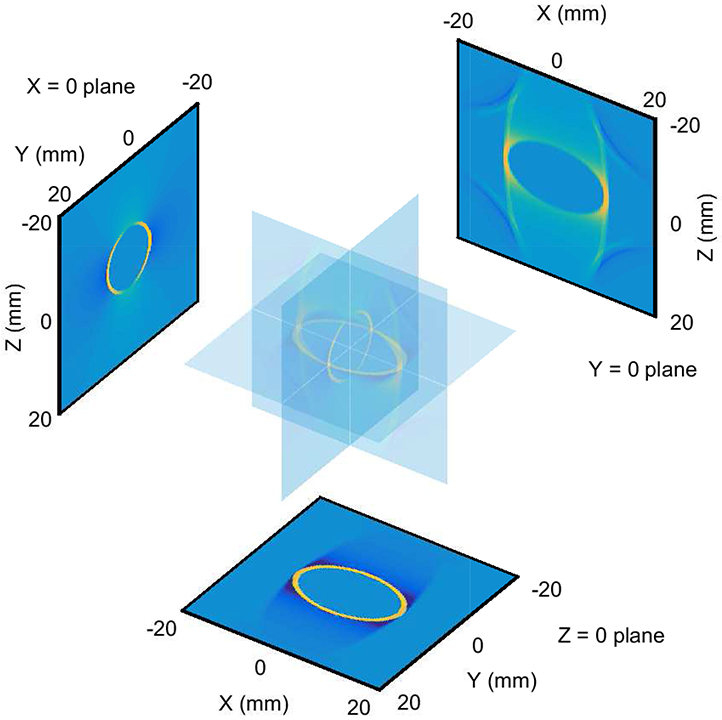
Views of shear wave signals in the X = 0, Y = 0, and Z = 0 planes at time t = 2.2 ms from a point source excitation located at the origin. The planes overlap and are shown with semi-transparency in the center, and are also duplicated without transparency at positions displaced from the center. The experimental configuration is shown in figure 1(a) with the material symmetry axis positioned along the X axis and the excitation force directed along the direction. The component of displacement is shown. Signals are shown for the case of a 200 μs excitation duration in a material with μL = 25 kPa, μT = 9 kPa, and ET/EL = 0.16. A movie showing the time evolution of these signals is included with supplementary material associated with this paper.