
Figure 5.
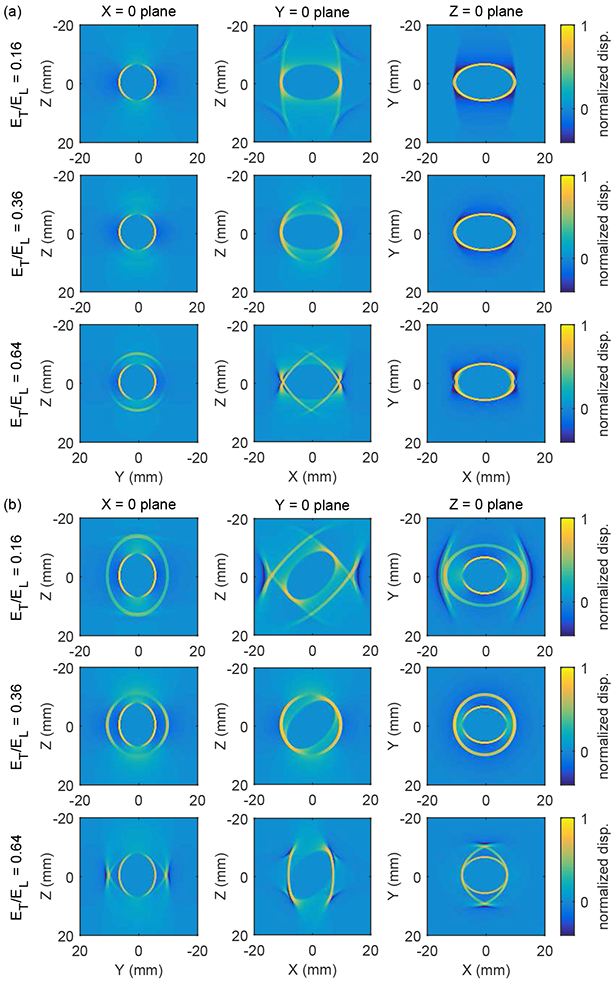
Normalized shear wave displacement signals in the X = 0, Y = 0, and Z = 0 planes (see figure 4) from a point source excitation located at the origin for cases with the material symmetry axis oriented (a) along the X axis as in figure 1(a), and (b) tilted at an angle of 45° relative to the X axis in the − plane as in figure 1(b). The excitation force is oriented in the direction, and the component of displacement is shown. Signals are shown at a time t = 2.2 ms for materials with μL = 25 kPa, μT = 9 kPa, and ET/EL = 0.16, 0.36, and 0.64. The top row of signals are the same as the signals in figure 4. Movies showing the time evolution of these signals are included with supplementary material associated with this paper.