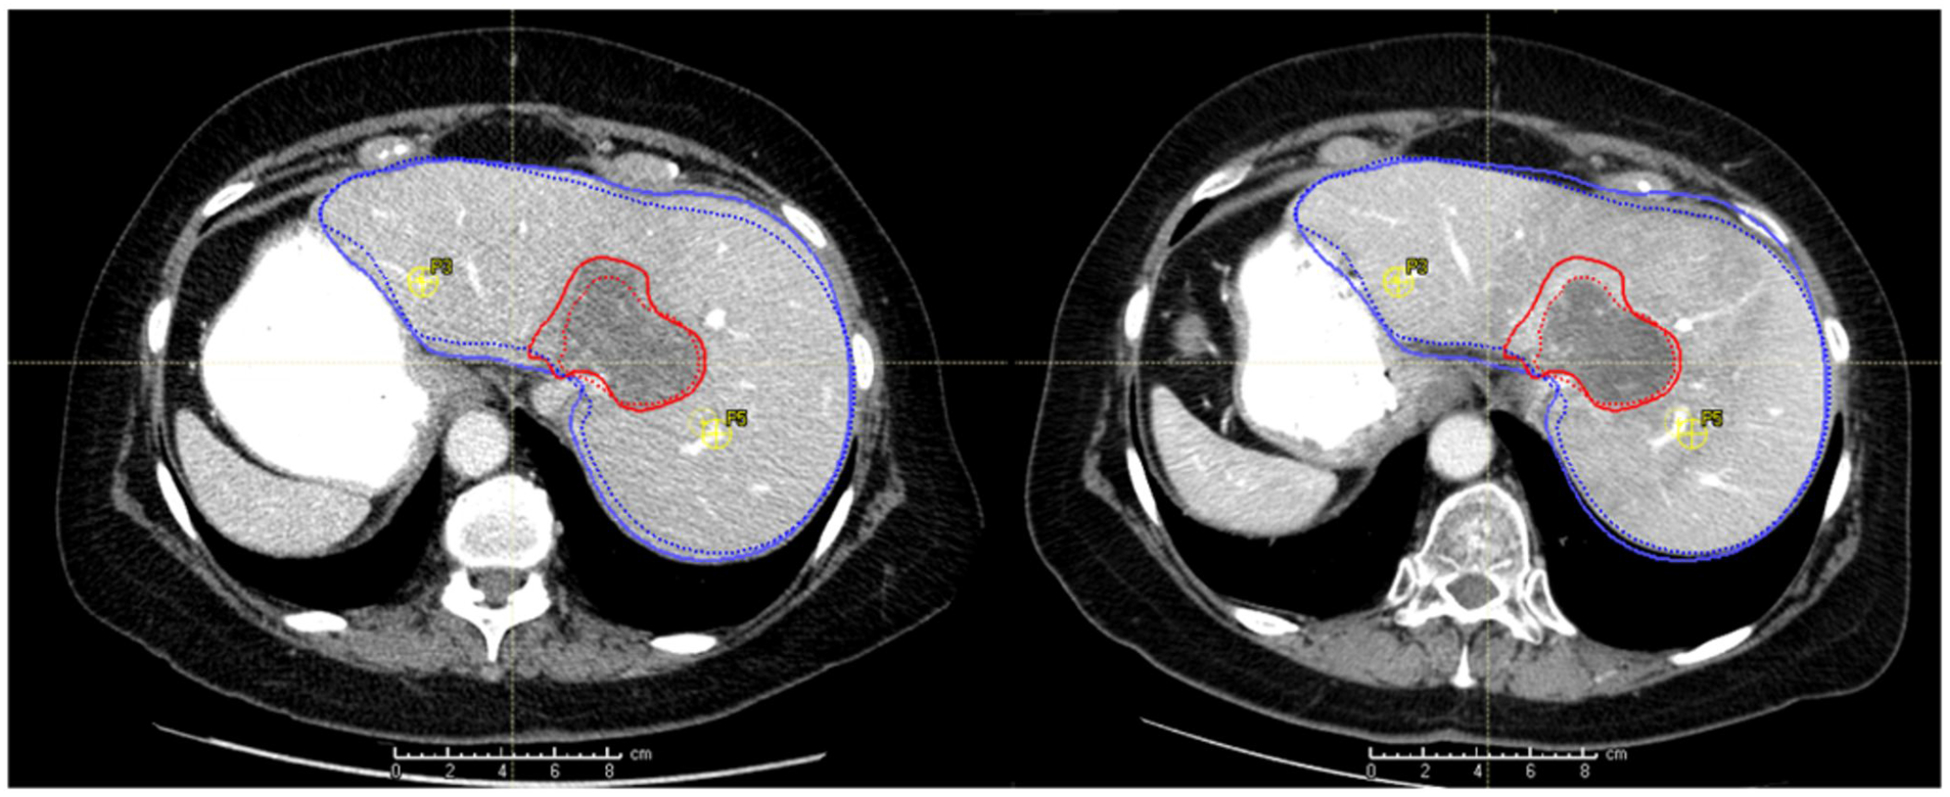
Figure 1:

Pre- and post-treatment images for a patient. The liver and tumor are contoured in blue and red, respectively. Contours for the pre-treatment image are in solid lines while those for the post-treatment image are in dotted lines. Two of the points (vessel bifurcations) for the TRE calculation are also marked in yellow.
