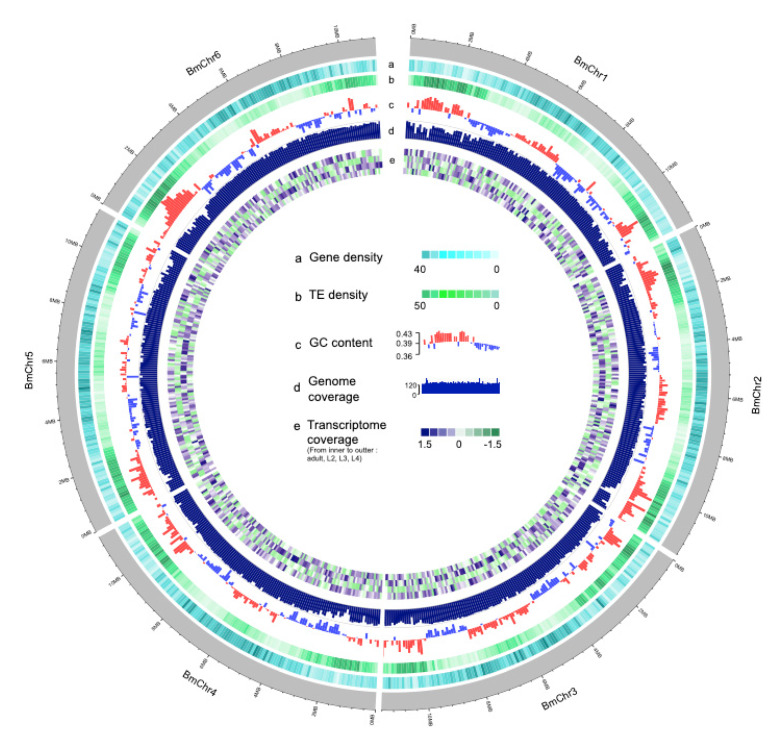
Figure 1.
Circos view of the Bursaphelenchus mucronatus genome. The outer grey lanes depict circular representation of pseudo-molecules. The tracks indicate the following character with window size in 100 Kb: (a) the density of genes (darker color indicates more genes), (b) TE (Transposable element) density, (c) GC (Guanine and Cytosine) content, (d) genome coverage, (e) transcriptome coverage (from inner to outer indicate the different stage: adult, L2 (Second instar larvae), L3 (Third instar larvae), L4. (Fourth instar larvae). All values are normalized by Z-score).

