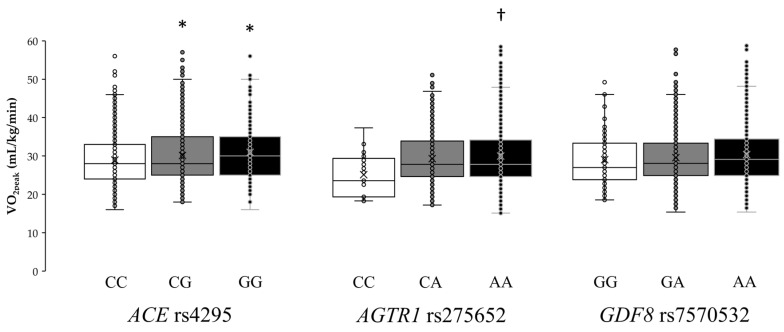
Figure 3.
Box-and-whisker plots showing peak oxygen uptake (VO2peak) in the study participants according to genetic variations in the genes for angiotensin-converting enzyme (ACE; rs4295), angiotensin II receptor type 1 (AGTR1; rs275652), and growth differentiation factor 8 (GDF8, also known as ‘myostatin’; rs7570532). The lines in the box represent the first, second (median) and third quartiles, and the whiskers represent 1.5 × interquartile ranges. Each dot represents one individual within the specified genotype. (*) Depicts a statistically significant difference from CC genotype in ACE rs4295 polymorphism at p < 0.05. (†) Depicts a statistically significant difference from CC genotype in AGTR1 rs275652 polymorphism at p < 0.05.

