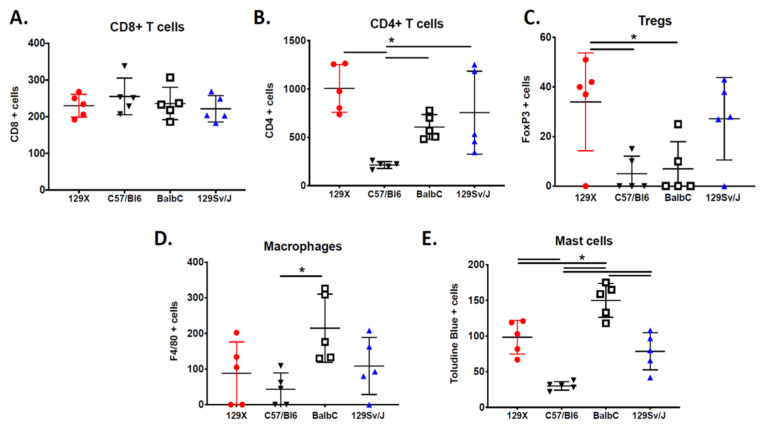
Figure 3.
The MPNST immune landscape is determined by genetic background. (A) Levels of CD8+ T cells in terminally-harvested MPNSTs are similar across all host strains. (B) Infiltration of CD4+ T cells are significantly lower in tumors from C57BL/6 mice compared to MPNSTs in mice from 129X1, BALB/c, and 129/SvJae backgrounds. (C) Foxp3+ Tregs are detected at higher levels in tumors from 129X1 mice compared to C57BL/6 and BALB/c mice. (D) MPNSTs from BALB/c mice have significantly higher levels of infiltrating F4/80+ macrophages compared to C57BL/6 mice. (E) Mast cell infiltration is higher in tumors from BALB/c mice compared to 129/SvJae, C57BL/6, and 129X1 mice. Mast cell levels are lowest in MPNSTs from C57BL/6 mice. 129X1 (red circles), C57BL/6 (black triangles), BABL/c (white squares), and 129/SvJae (blue triangles). Analyzed by one-way ANOVA with Tukey’s multiple comparison test. A p-value of less than 0.05 is considered statistically significant and is denoted by “*” (n = 5 tumors per strain).

