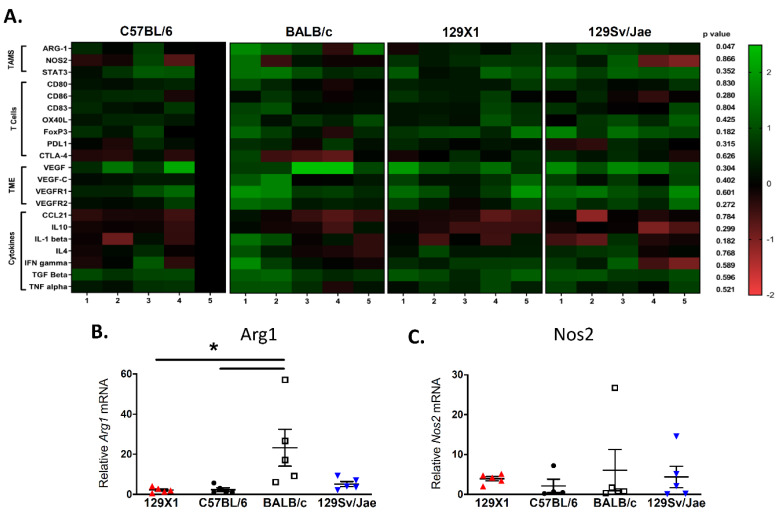
Figure 4.
Expression of key genes in the MPNST microenvironment. (A) RT-qPCR analysis of markers for innate immunity, adaptive immunity, angiogenesis, and cytokine signaling in terminally-harvested tumors shows a large degree of heterogeneity between host strains and individual tumors. Samples are normalized to a single C57BL/6 tumor, shown as reference (n = 5 tumors per strain). (B) Expression analysis determines that MPNSTs from BALB/c mice express significantly higher levels of Arg-1 mRNA, a marker of immunosuppressive M2 macrophages, when compared to tumors from 129/SvJae, C57BL/6, and 129X1 mice. (C) In contrast, levels of Nos2 mRNA, a marker of M1 macrophages, is similar in tumors from all background strains. 129X1 (red circles), C57BL/6 (black triangles), BABL/c (white squares), and 129/SvJae (blue triangles). Analyzed by one-way ANOVA with Tukey’s multiple comparison test. A p-value of less than 0.05 is considered statistically significant and is denoted by “*”.

