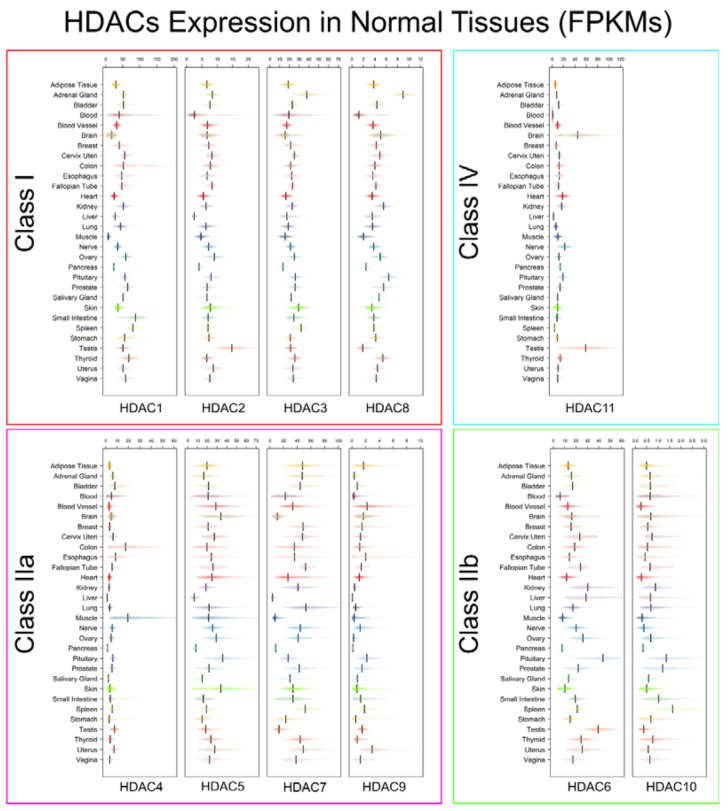
Figure 4.
Transcript levels of HDACs 1–11 in healthy tissues expressed in FPKM (fragments per kilobase of transcript length per million of mapped reads). Boxplots show the expression of Class I (red box), Class IIa (pink box), Class IIb (green box), and Class IV (aquamarine box) from normal samples in the GTEx Release V8 dataset. Expression was FPKM-normalized using the length of ENSEMBL longest isoform and RNA-Seq data from GTEx [105].

