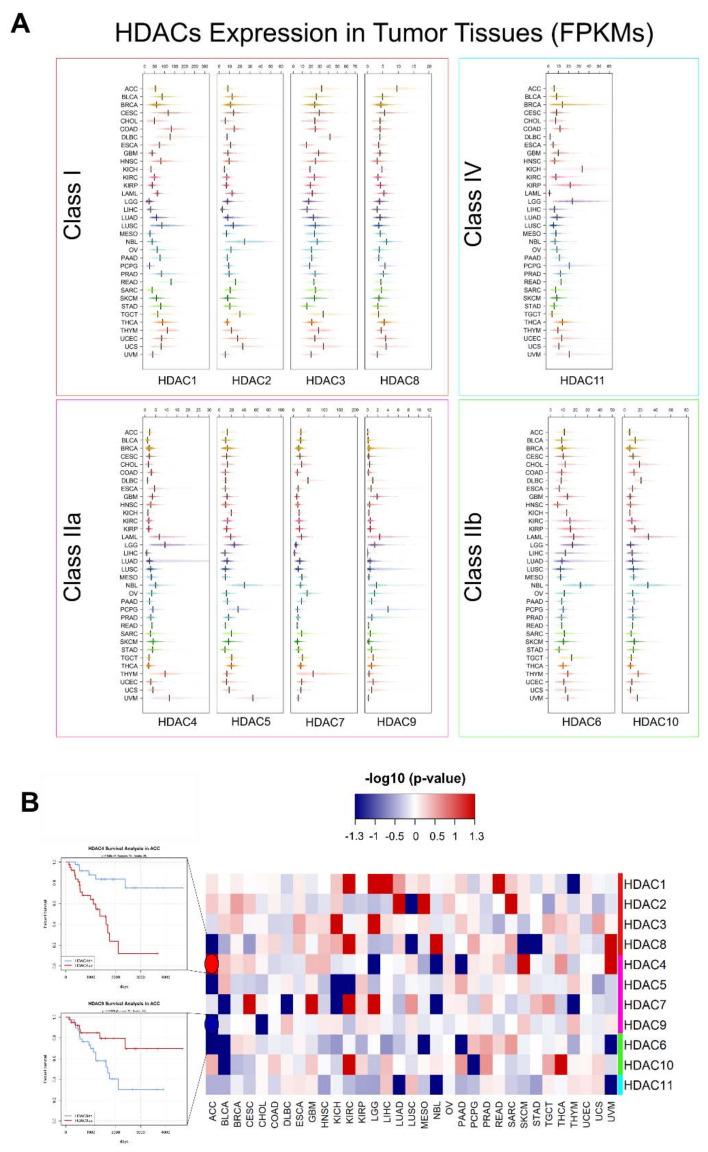
Figure 6.
(A) Transcript levels of HDACs 1–11 in tumor tissues expressed in FPKM. Boxplots shows the expression of Class I (red box), Class IIa (pink box), Class IIb (green box), and Class IV (aquamarine box) from tumor samples in the pan-cancer TCGA dataset [187]. Tumor types are: ACC, adrenocortical carcinoma; BLCA, bladder urothelial carcinoma; BRCA, breast invasive carcinoma; CESC, cervical squamous cell carcinoma and endocervical adenocarcinoma; CHOL, cholangiocarcinoma; COAD, colon adenocarcinoma; DLBC, lymphoid neoplasm diffuse large B-cell lymphoma; ESCA, esophageal carcinoma; GBM, glioblastoma multiforme; HNSC, head and neck squamous cell carcinoma; KICH, kidney chromophobe; KIRC, kidney renal clear cell carcinoma; KIRP, kidney renal papillary cell carcinoma; LAML, acute myeloid leukemia; LGG, brain lower grade glioma; LIHC, liver hepatocellular carcinoma; LUAD, lung adenocarcinoma; LUSC, lung squamous cell carcinoma; MESO, mesothelioma; OV, ovarian serous cystadenocarcinoma; NBL, TARGET-neuroblastoma [188]; PAAD, pancreatic adenocarcinoma; PCPG, pheochromocytoma and paraganglioma; PRAD, prostate adenocarcinoma; READ, rectum adenocarcinoma; SARC, sarcoma; SKCM, skin cutaneous melanoma; STAD, stomach adenocarcinoma; TGCT, testicular germ cell tumors; THYM, thymoma; THCA, thyroid carcinoma; UCS, uterine carcinosarcoma; UCEC, uterine corpus endometrial carcinoma, UVM, uveal melanoma. Expression was FPKM-normalized using the length of ENSEMBL longest isoform and RNA-Seq data from TCGA. (B) Integrated HDAC survival analysis across tumors. Color intensity in the heatmap is proportional to -log10(p-value), a threshold of |1.3| corresponds to a p-value = 0.05. Red boxes in the heatmap correspond to a worse OS when the corresponding HDAC is upregulated, while blue boxes mean a better OS in case of upregulation, as shown by example survival curves (left side).

