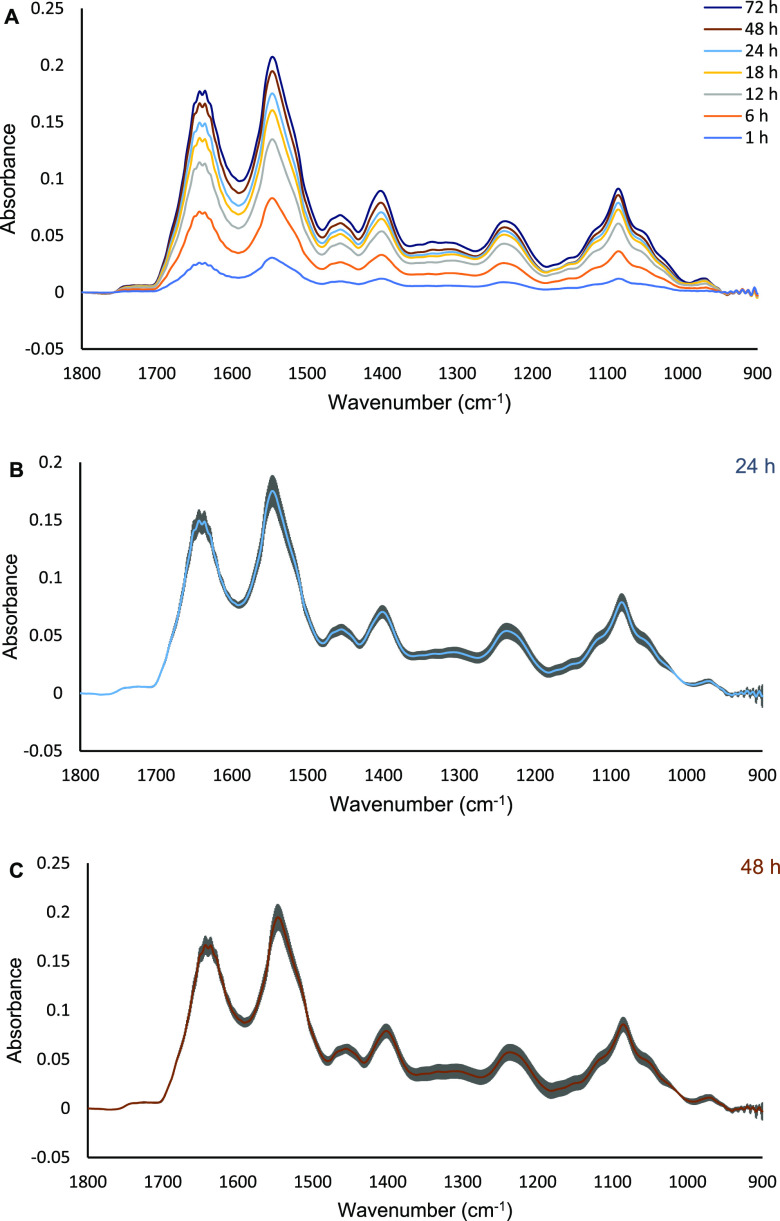
Figure 1.
Representative ATR FTIR spectra of MCF7 cells seeded on the ATR element for 72 h (A). The spectra are an average of four independent FTIR measurements. A straight line between 1800 and 950 cm–1 was used to baseline the spectra. The error bars of the 24th and 48th h average spectra are presented in (B,C), respectively (n = 4). The gray color in (B and C) indicates the standard deviations of the measurements for every wavenumber (cm–1).

