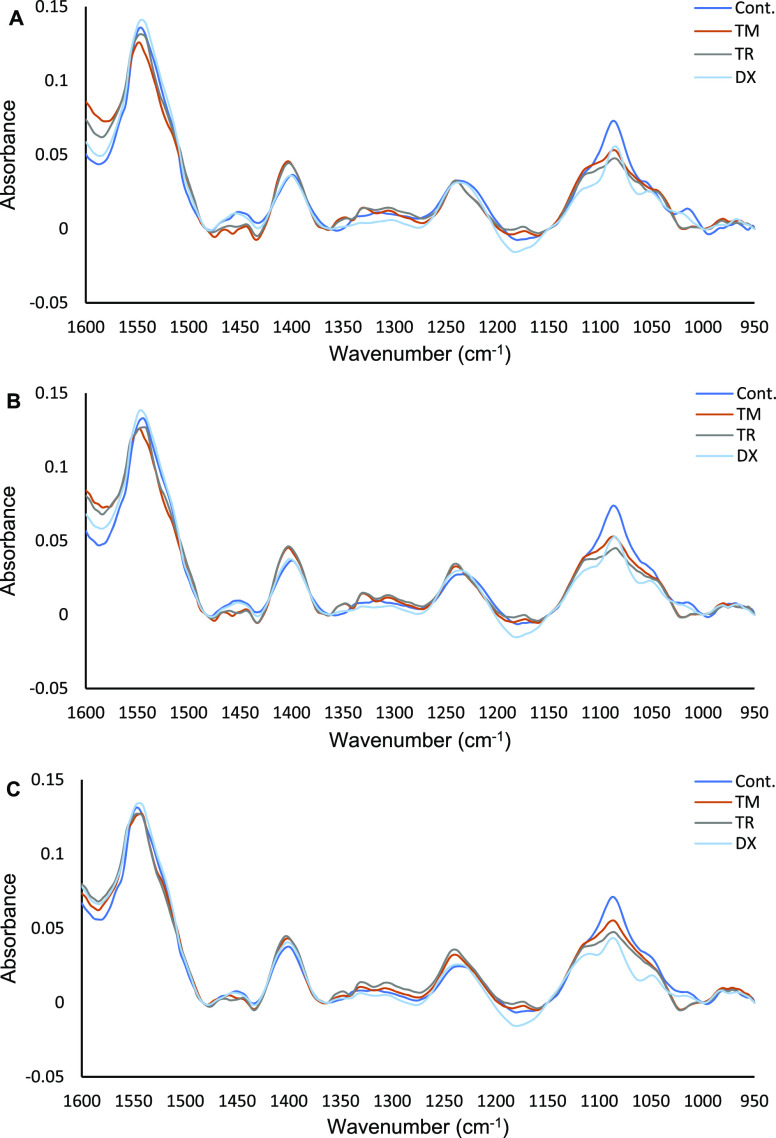
Figure 3.
FTIR (vector normalized) difference spectra of live MCF7 cells after exposure to 0.1% dimethyl sulfoxide (DMSO) [drug vehicle; control(C)] and IC50 of tamoxifen (TM), toremifene (TR), and doxorubicin (DX) for 2, 4, and 6 h (A, B, and C, respectively). The spectra presented are an average of four repeated measurements for each condition. Refer to Figure S5 for the average spectra with error bars.

