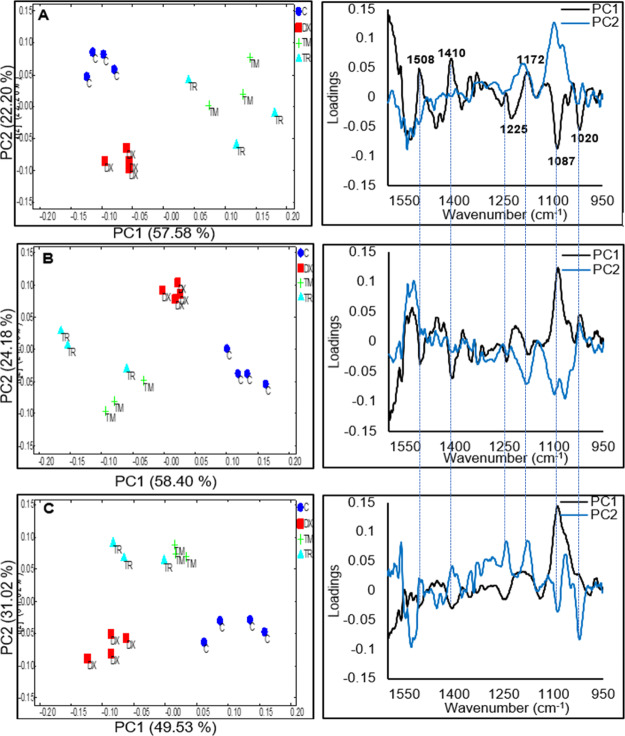
Figure 4.
PCA scores and their corresponding loadings of FTIR vector normalized difference spectra of live MCF7 cells after exposure to 0.1% DMSO (control) and IC50 of tamoxifen (TM), toremifene (TR), and doxorubicin (DX) in the 2nd h (A), 4th h (B), and 6th h (C). Vertical lines were added to the loading plots to aid in the comparison between the different hours of treatment.

