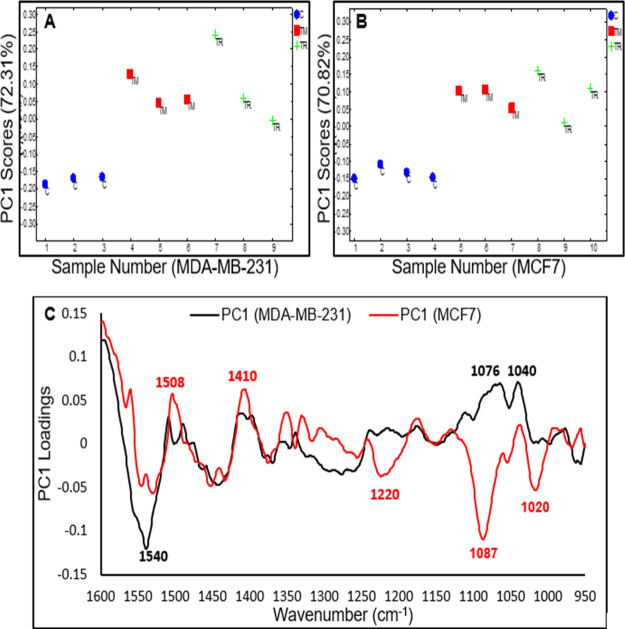
Figure 5.
(A) Pairwise PC1 scores of MDA-MB-231 cells for control (1–3) vs tamoxifen (4–6) and toremifene (7–9). (B) Pairwise PC1 score of MCF7 cells for control (1–4) vs tamoxifen (5–7) and toremifene (8–10). (C) Corresponding PC1 loadings of MDA-MB-231 cells (black spectrum) and MCF7 (red spectrum) after the 2nd h of exposure to the IC50 of tamoxifen/toremifene.

