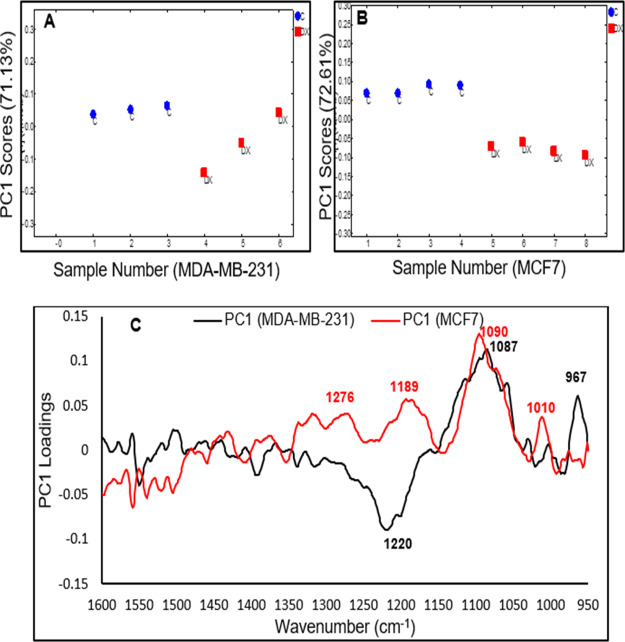
Figure 6.
(A) Pairwise PC1 scores of MDA-MB-231 cells for control (1–3) vs doxorubicin (4–6). (B) Pairwise PC1 scores of MCF7 cells for control (1–4) vs doxorubicin (5–8). (C) Corresponding PC1 loadings of MDA-MB-231 cells (black spectrum) and MCF7 (red spectrum) after the 2nd hour of exposure to the IC50 of doxorubicin.

