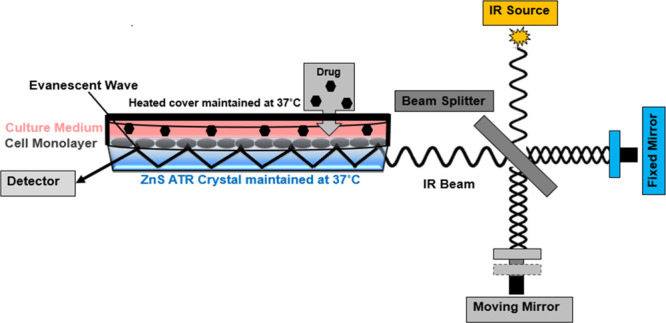
Figure 7.

Schematic describing the ATR element and the cell culture set up for the live cells FTIR measurement. An IR beam from the interferometer is shone on the live cells intimately adhered to the ATR surface and undergoes internal reflections. The generated evanescent wave penetrates (∼2–3 μm) and is absorbed by the sample (cells), which is then converted to an ATR absorbance spectrum by FT.
