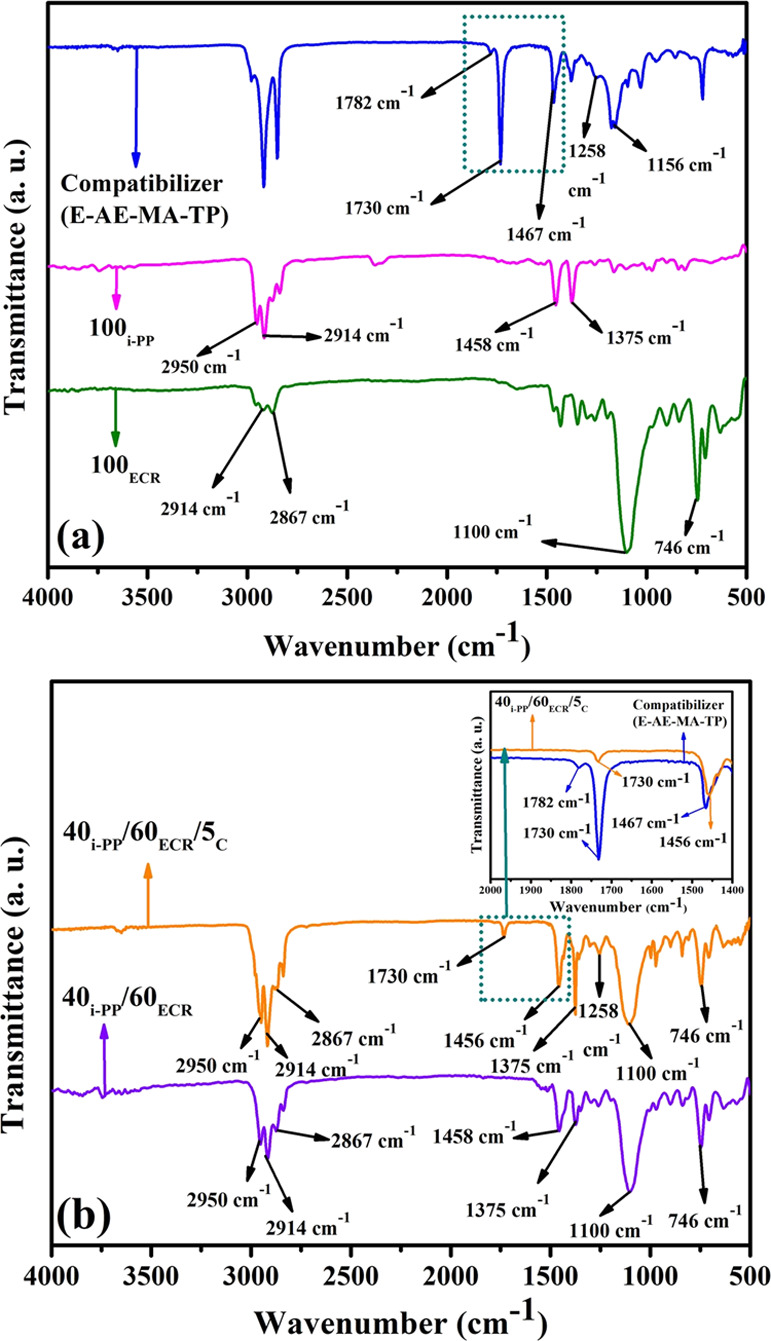
Figure 3.

(a) FTIR spectra of 100ECR, 100i-PP, and the E-AE-MA-TP compatibilizer and (b) FTIR spectra of the 40i-PP/60ECR blend and 40i-PP/60ECR/5C blend. Inset of (b): FTIR spectra of the region between 2000 and 1400 cm–1 of the E-AE-MA-TP compatibilizer and 40i-PP/60ECR/5C blend.
