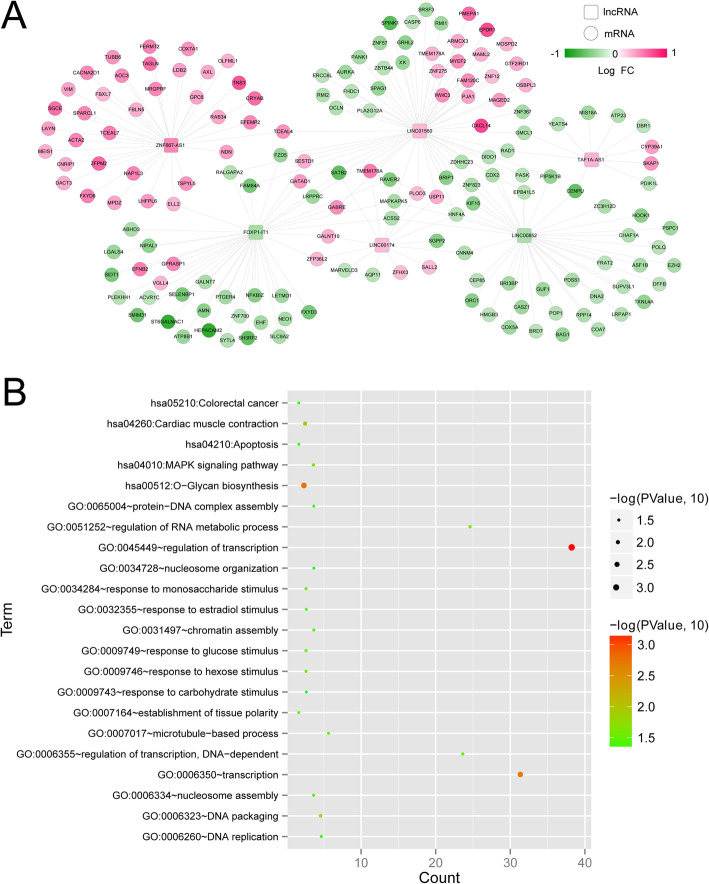
Fig. 6.
Construction of co-expression network and functional analysis. a The co-expression network of differentially expressed (DE) lncRNAs and DEmRNAs. The red color shows the upregulated lncRNAs or mRNAs, and the green color denotes the downregulated lncRNAs or mRNAs. Squares and circles, respectively, represent lncRNAs and mRNAs. b GO and KEGG pathways of DEmRNAs. Horizontal axis and vertical axis represent the gene number and term, respectively; the color and size of the bots indicate the significant P value, and the closer the color is to red, the higher the significance

