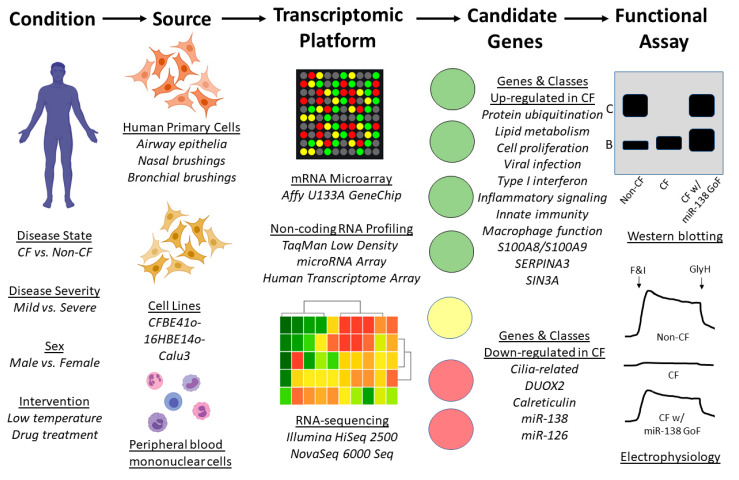
Figure 3.
Workflow of transcriptomic profiling. To identify transcriptomic changes resulting from cystic fibrosis (e.g., disease presence or severity), multiple primary and immortalized cell sources are available, as are several profiling platforms. Analysis of profiling output reveals differentially expressed genes (DEGs) and gene classes; findings highlighted in the text are shown under “Candidate Genes”. The effects of manipulating DEGs (e.g., gain of function (GoF) can be assessed using multiple assays. Examples of CFTR western blotting and electrophysiology as endpoints are presented with hypothetical data representing overexpression of miR-138 [58]. F&I represent the cyclic AMP agonists forskolin and IBMX. GlyH represents CFTR inhibitor GlyH-101.

