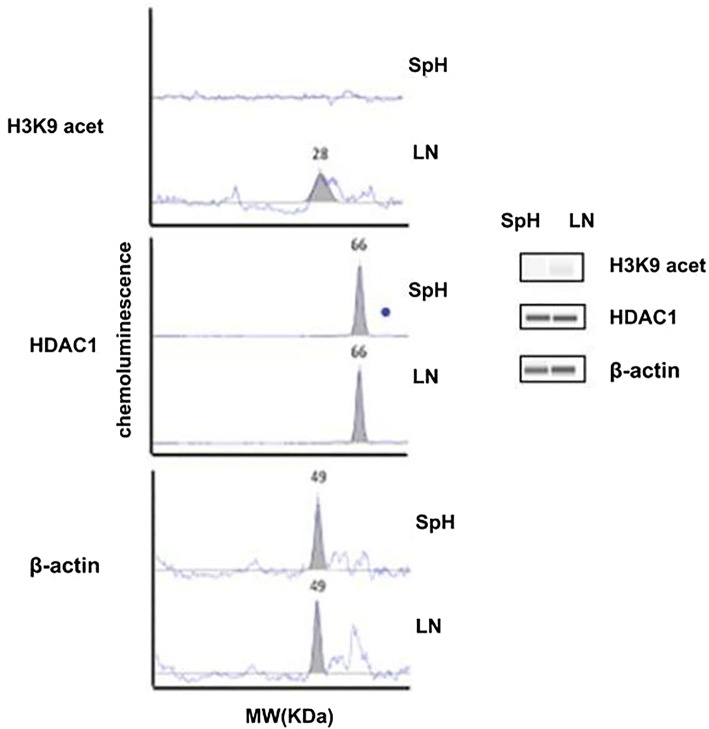
Fig. 2.
Histone H3 acetylation and HDAC1 expression in the sphere and LNCaP cells. Capillary electrophoresis-western blot analysis was used to assess the level of acetylated H3K9 and HDAC1 expression. The electropherogram of acetylated H3K9, HDAC1, and β-actin proteins from the lysates of the LNCaP cells (LN) and spheres (SpH) is shown in the left panel, where Y axis represents the chemiluminescence and the X axis molecular weight (kDa). The right panel of the figure shows the Western blot images of H3K9, HDAC1 and β-actin. The β-actin was used as a loading control

