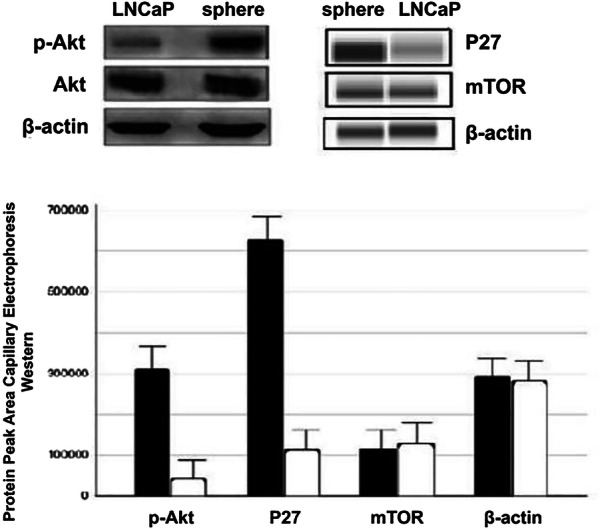
Fig. 3.

Analysis of phosphoinositol-3 kinase pathway members. Upper left panel: representative blots of p-AKT and AKT expression in the LNCaP cells and the spheres. β-actin was used as a loading control. Upper right panel: representative blots from capillary electrophoresis-western blot of protein p27 and mTOR from the spheres and the LNCaP cells. β-actin was used as a loading control. The bar graph in the lower panel depicts quantity of the protein expression in chemiluminescence units (area under peak) for each protein assayed by the capillary electrophoresis-western blot analysis. Solid bars indicate the values of the spheres, and open bars the values of LNCaP cells. Columns and vertical bars are means and ranges from independent experiments. The levels of p-AKT and P27 in the spheres and LNCaP cells were statistically significant (P < 0.05)
