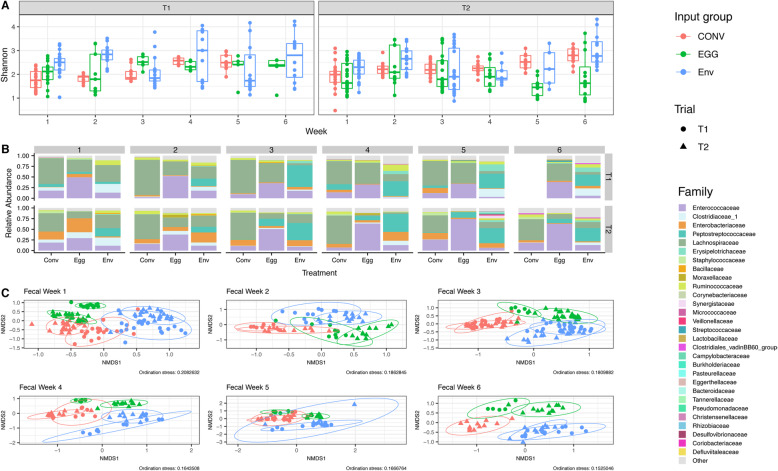
Fig. 3.
Comparisons of fecal swab bacterial community composition throughout both T1 and T2. a Changes in fecal swab microbiota alpha-diversity (Shannon index) for different microbiota input groups throughout the 6-week trial period for both T1 and T2. Comparisons between Shannon indices between microbiota input groups, weeks, and trials were made using an analysis of variance (ANOVA) followed by subsequent pairwise comparisons with the Tukey’s “Honest Significant Difference” method. b Stacked barcharts comparing the weekly relative abundance of bacterial families representing > 0.01 (1%) of the fecal swabs bacterial community at any time point within either T1 or T2. c Weekly beta-diversity of fecal swab microbiota communities between different microbiota input groups for both T1 and T2. Weekly population level PERMANOVA statistics (F.models and q-values) between microbiota input groups within the same trial and between trials within the same input group are detailed in Figure S3. Ellipses were generated around points to aid in visualizing group differences assuming a multivariate T-distribution with a 95% confidence interval. Fecal swabs were not collected for T1 CONV birds at week 6

