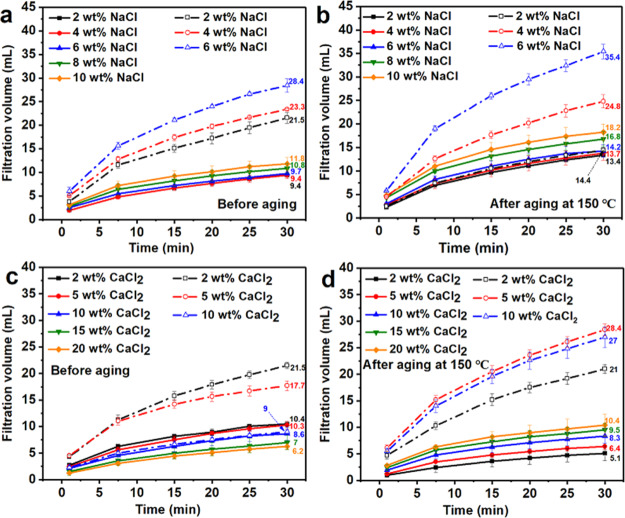
Figure 13.
Filtration volume of bentonite/E-2 wt % and bentonite/W-2 wt % after adding a different concentration of NaCl: (a) before aging and (b) after aging at 150 °C or CaCl2: (c) before aging and (d) after aging at 150 °C (the solid lines represent the bentonite/E-2 wt % system, and the dash lines represent the bentonite/W-2 wt % system).

