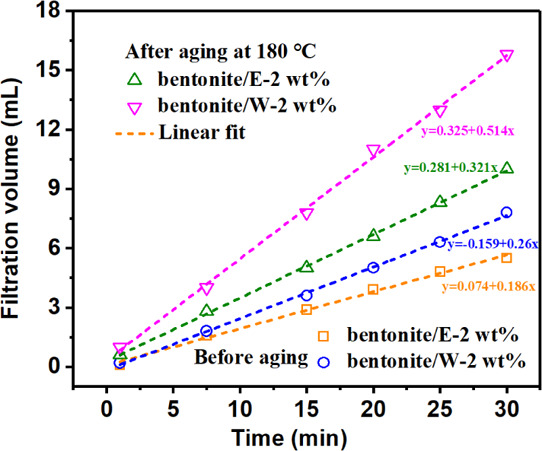
Figure 7.

Filtration rate (q) determination of the already formed filter cake from bentonite/E-2 wt % and bentonite/W-2 wt % [dashed lines in the figure represent the linear fitted lines and the slope of each line indicates the filtration rate (q, mL/min) of each filter cake].
