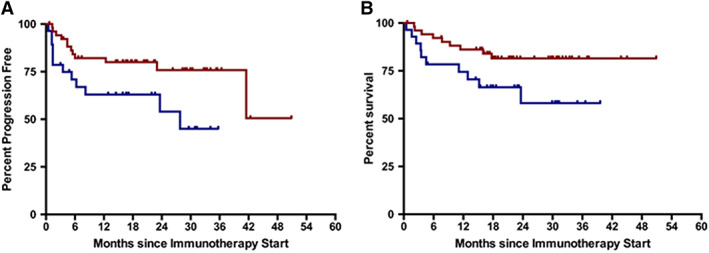
Figure 2.

Survival analyses. (A): Progression‐free survival curves according to number of tumor infiltrating lymphocytes (TILs). (B): Overall survival curves according to number of TILs. Red indicates high number of TILs; blue indicates low number of TILs.
