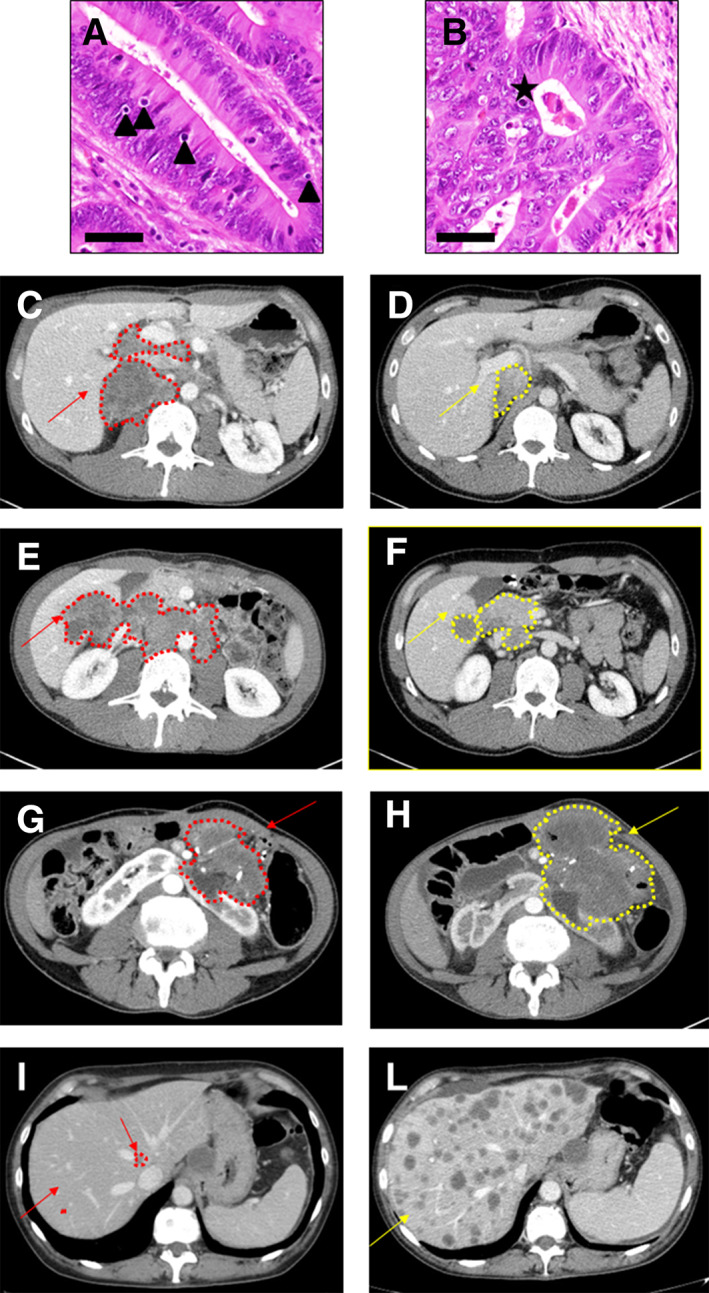
Figure 3.

Histologic and radiologic imaging of two representative cases. (A): Example of tumor with high number of tumor infiltrating lymphocytes (TILs); triangles show TILs. Bar scale, 100 μm. (B): Example of tumor with low number of TILs; star shows apoptotic body. Bar scale, 100 μm. (C–F): Baseline (C, E) and best response (D, F) computed tomography (CT) scans of two representative cases with high number of TILs. (G–L): Baseline (G, I) and 8‐weeks first assessment (H, L) CT scans of two representative cases with tumors with low number of TILs showing a clearly progressive disease. Red indicates baseline lesions; yellow indicates best overall response to ICI.
