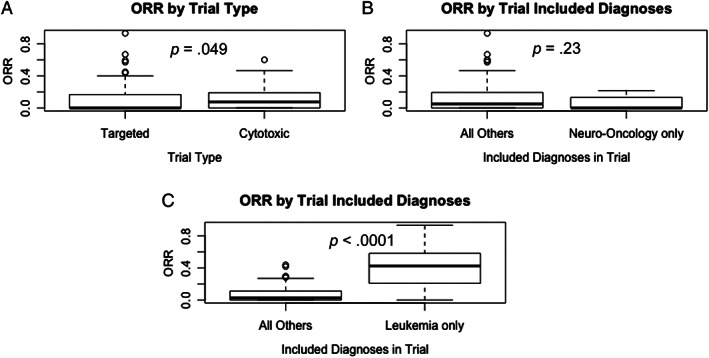
Figure 3.

The ORR per trial for all included trials. (A): Targeted (n = 61) and cytotoxic (n = 48) trial groups. (B): Neuro‐oncology–only trials (n = 21) and all other trials (n = 88). (C): Leukemia‐only trials (n = 19) and all other trials (n = 90). Box‐and‐whisker plots display the 25th percentile, median, and 75th percentile, with end of whiskers designating 1.5 × interquartile range (IQR). Circles depict potential outliers, for those trials with ORR greater than 1.5 × IQR from the median.Abbreviation: ORR, objective response rate.
