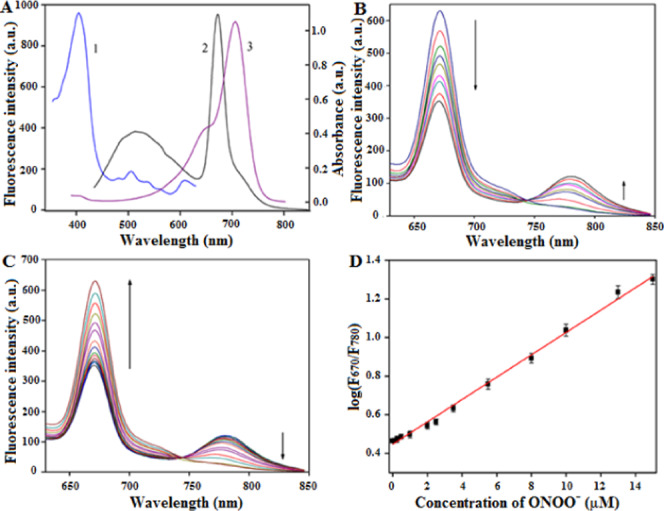
Figure 2.

(A) Fluorescence excitation (1) and emission (2) spectra of NI-BQDs, and absorption spectra (3) of Cy7. (B) With the increase of the Cy7 concentration, the fluorescence intensity of NI-BQDs decreased, while the fluorescence intensity of Cy7 increased. (C) Fluorescence spectra of NI-BQD-Cy7 in the presence of different concentrations of ONOO– (0–15 μM). (D) Linear relationship between the logarithm value of the fluorescence intensity ratio (I670/I780) and the ONOO– concentration.
