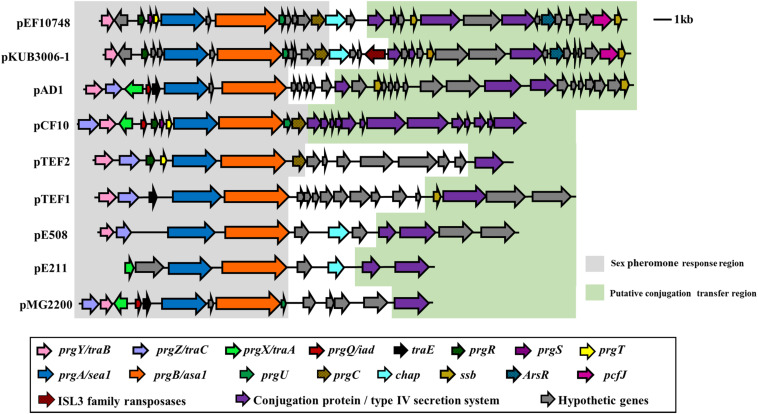
FIGURE 3.
Comparison of the sex pheromone gene cluster among known sex pheromone plasmids. Different genes are color-coded as shown in the box on the bottom. Of note, for the region shown, the gene organization in plasmid pEF10748 identified in this study is most similar to that of pKUB3006-1 reported by Kuroda et al. (2018). The bacterial origin and GenBank accession numbers of all plasmids shown are available from Supplementary Table S4.

