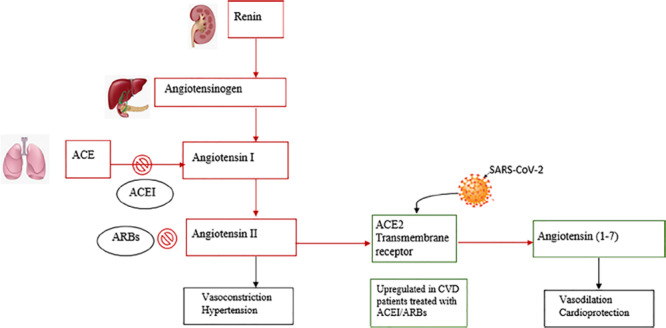
FIGURE 2.

RAS inhibition by ACEI/ARBs and SARS-CoV-2 binding to ACE2 receptors. Red squares indicate RAS actions. Green squares indicate ACE actions. Black squares indicate effects for each component. RAS indicates renin-angiotensin system. Reprinted with permission from Eur J Epidemiol 2020;35:335–337.
