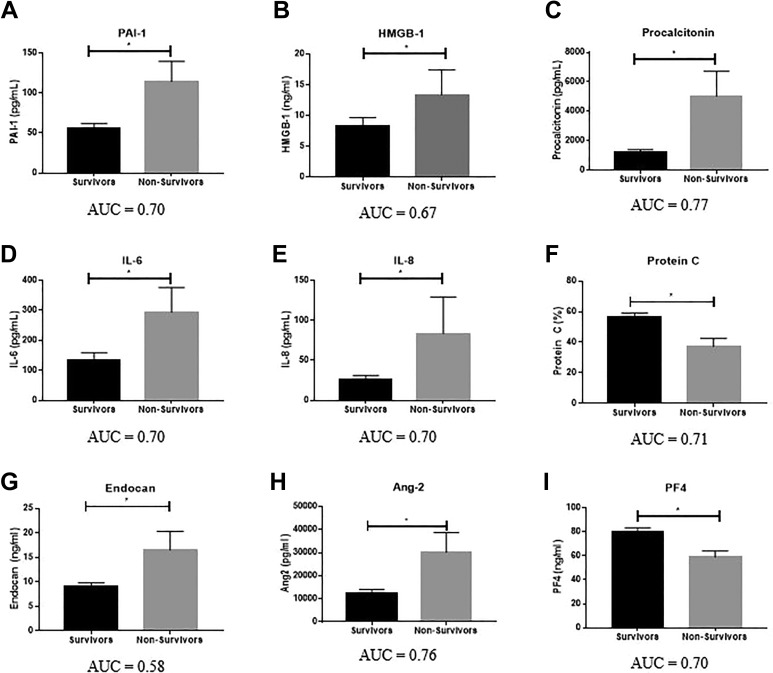
Figure 2.
Association of biomarker levels with survival. Significance calculated between groups using the Mann-Whitney test, with P < .05 as the cutoff for significance (indicated by *). Data are shown as mean ± SEM. Area under the receiver operating curve (AUC) is reported below each graph. SEM indicates standard error of the mean.

