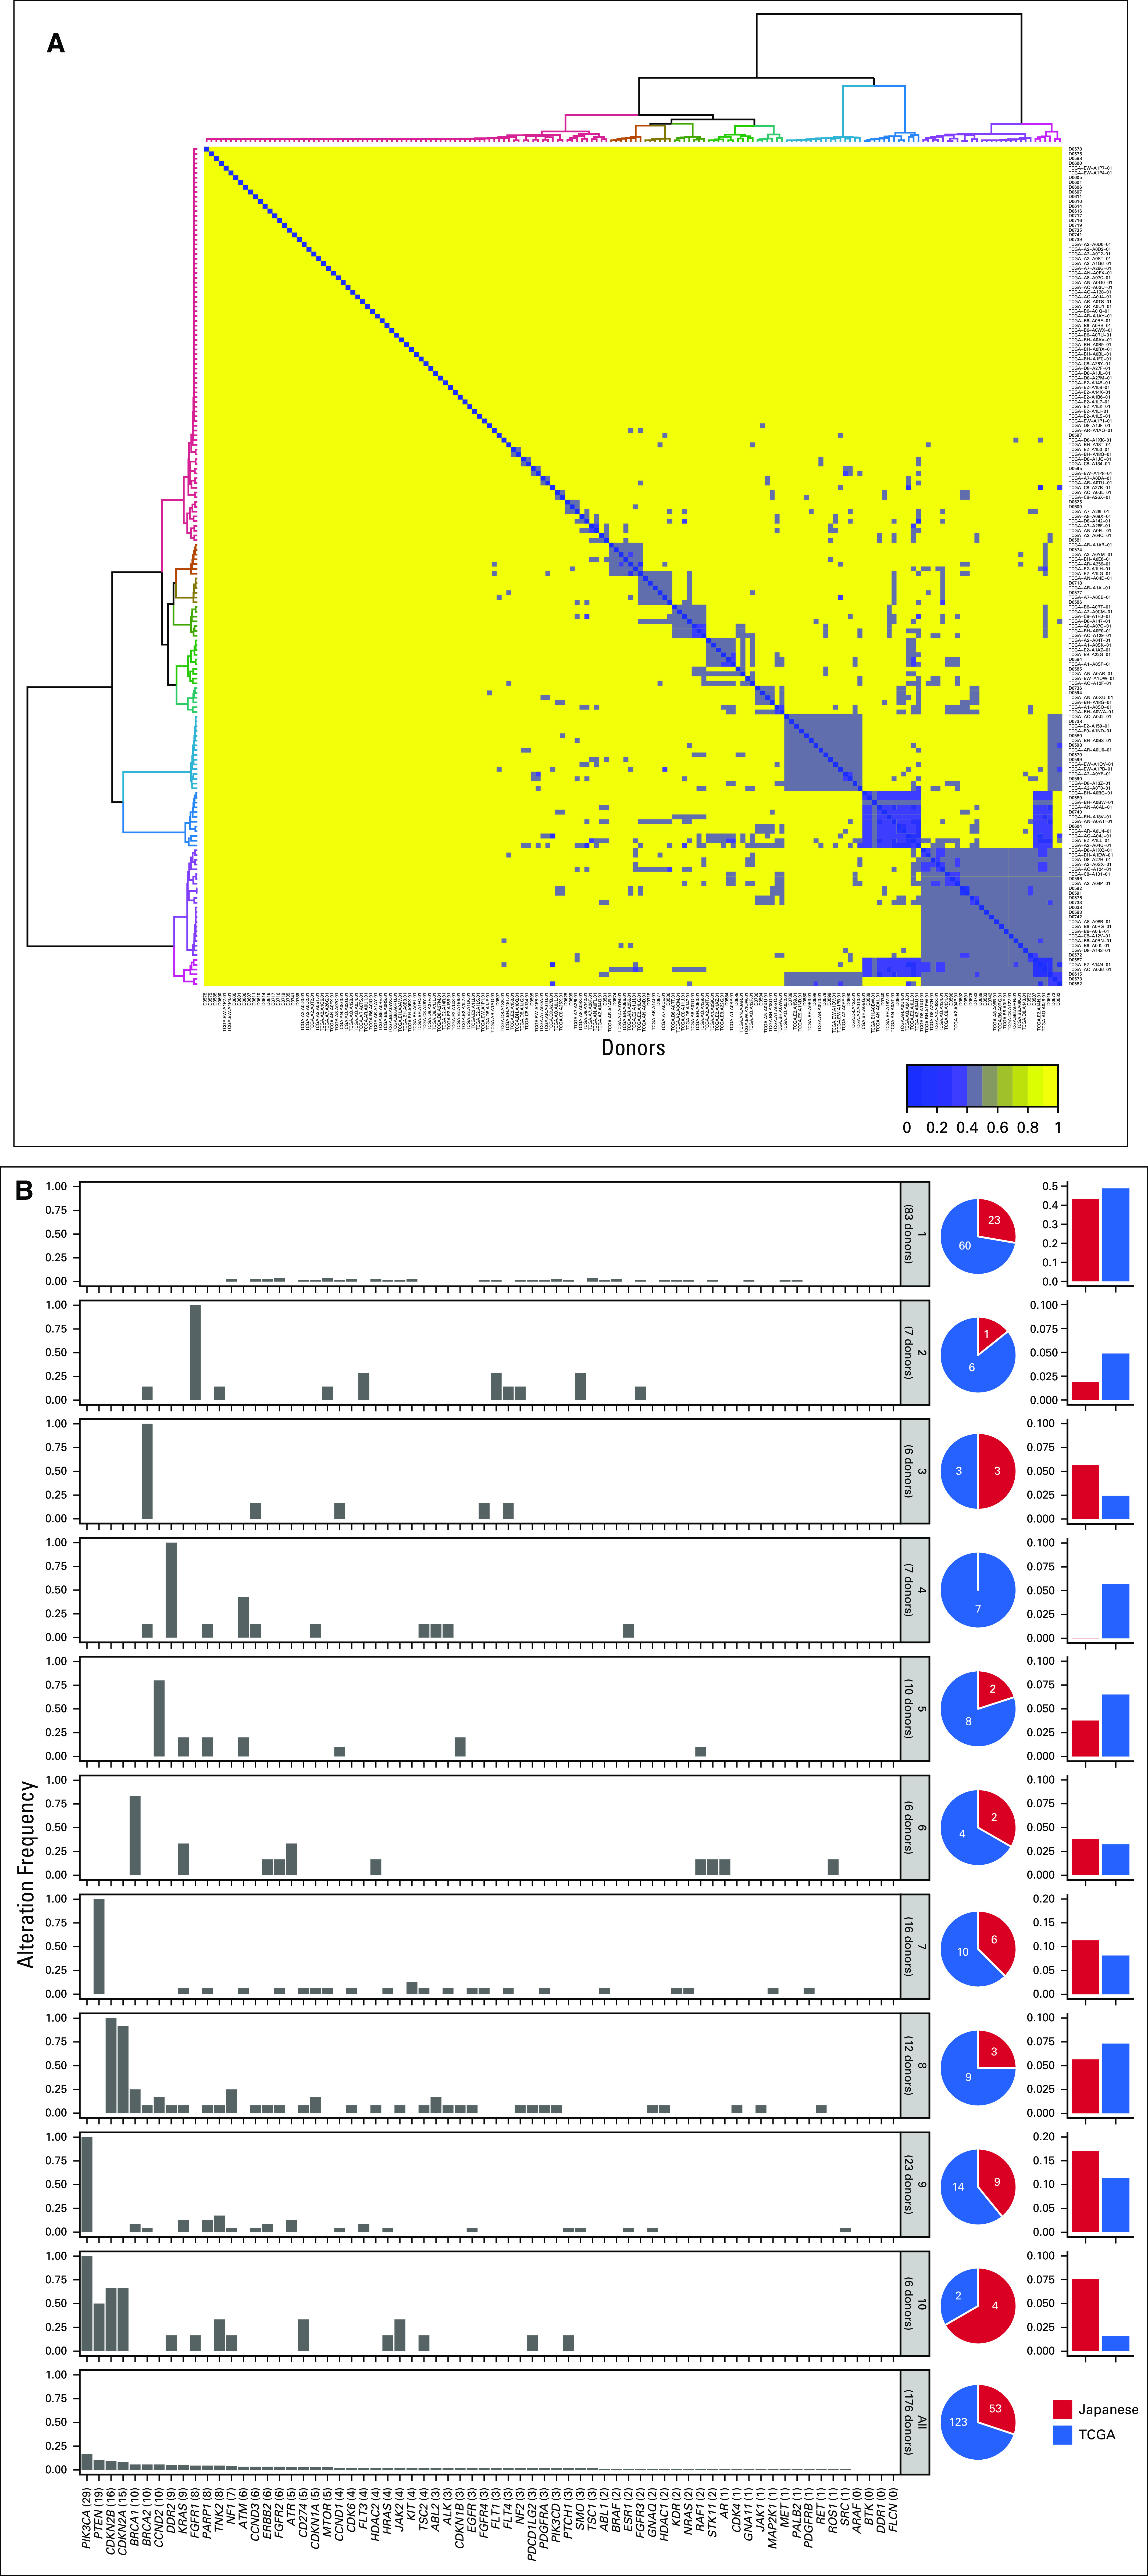
Fig 4.

Cluster of 68-gene coalteration patterns. (A) A cluster analysis was performed on 176 cases of triple-negative breast cancer (TNBC; 53 tumors from Japanese patients and 123 tumors from The Cancer Genome Atlas [TCGA] cohort) by using Euclidean distance and Ward’s clustering method (distance based on common mutated genes are colored blue to yellow). The 68 genes associated with a US Food and Drug Administration–approved drug (on or off label) were used for clustering. (B) Comutated gene patterns of a 68-gene set. The percentage of Japanese patients and the percentage of the TCGA cohort in each cluster are shown in the pie graphs displayed on the right side. The alteration rate in each cluster is shown as a bar graph in the far right.
