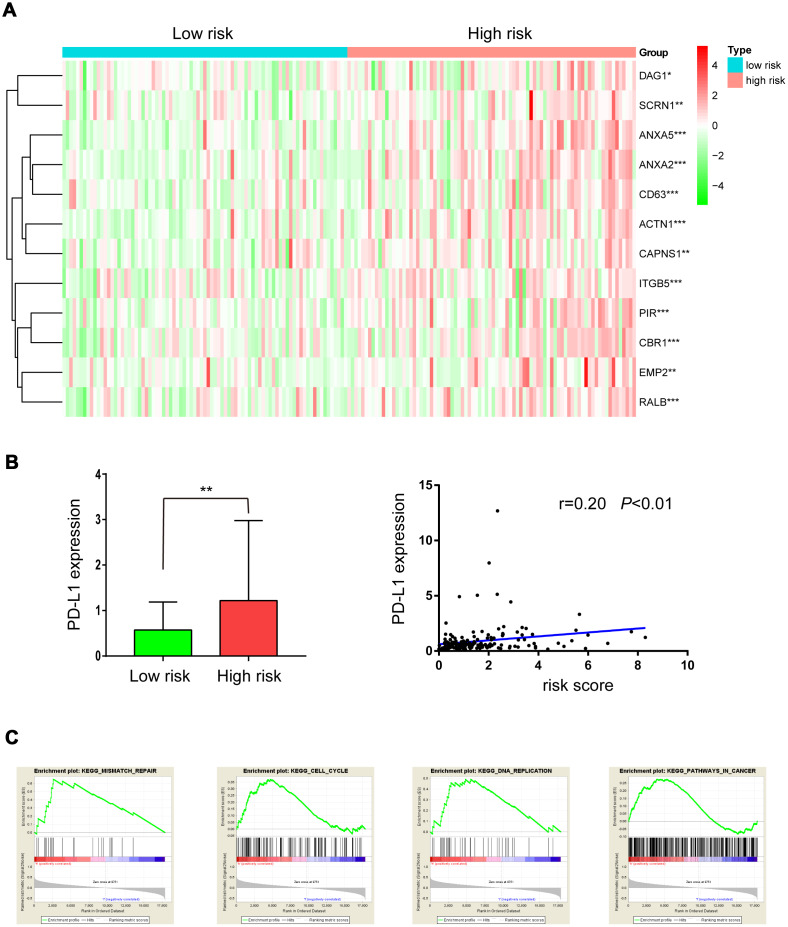
Figure 7.
Expression of radioresistant genes and GSEA enrichment analysis in low- and high-risk groups. (A) Heatmap showing the expression of 12 radioresistant genes that were up-regulated in the high-risk group; (B) PD-L1 expression in low- and high-risk groups; (C) GSEA enrichment in low- and high-risk groups.

