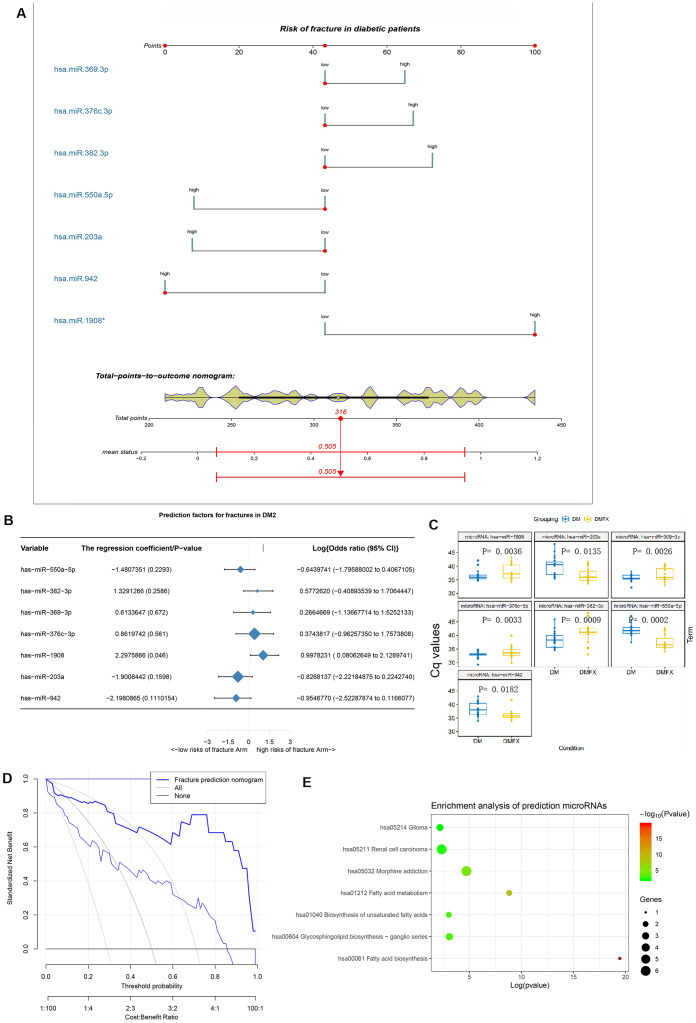
Figure 4.
The establishment and validation of the risk prediction model of diabetic fracture. (A) Developed diabetic fracture nomogram. Note: The diabetic fracture nomogram was developed in the cohort, with hsa-miR-550a-5p, hsa-miR-382-3p, hsa-miR-369-3p, hsa-miR-376c-3p, hsa-miR-1908, hsa-miR-203a and hsa-miR-942 incorporated. (B) Predictive factors of fractures in patients with DM2. (C) Differential miRNA expression levels between with (DMFX) and without (DM) fragility fractures in the postmenopausal women with type 2 diabetes. To enable intuitive interpretation of upregulation and down-regulation, Cq values are inverted along the y axis. (D) Decision curve analysis for the diabetic fracture nomogram. (E) Enrichment analysis of hsa-miR-550a-5p, hsa-miR-382-3p, hsa-miR-369-3p, hsa-miR-376c-3p, hsa-miR-1908, hsa-miR-203a and hsa-miR-942 using mirPath v.3.

