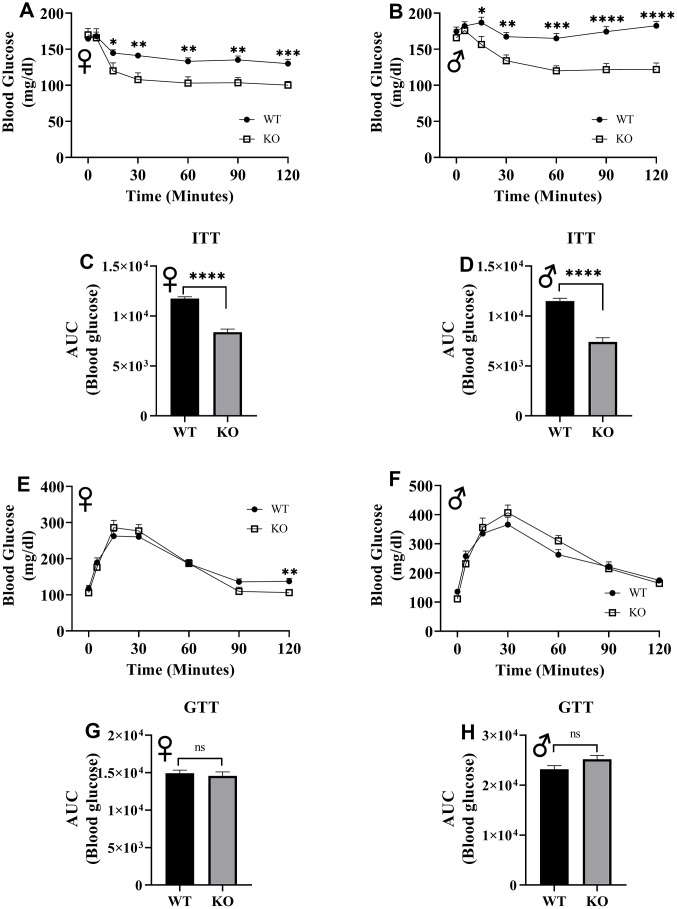
Figure 12.
Insulin and glucose tolerance tests. GHRH-/- and WT mice were fasted for 4 hours and injected with 1 IU porcine insulin per kg of body weight. Blood glucose levels of female (A) and male (B) were measured the following 2 hours. Area under the curve analyses for female (C) and male (D) mice are shown. GHRH-/- and WT mice were fasted overnight and injected with 1 g glucose per kg of body weight. Blood glucose levels of female (E) and male (F) were measured the following 2 hours. Area under the curve analyses for female (G) and male (H) mice are shown. Female WT n=14, GHRH-/- n=13, male WT n=14, GHRH-/- n=13-14. Each bar represents mean ± SEM. Statistical analysis was performed by unpaired Student’s t-test with Welch’s correction; *p<0.05, **p<0.01, ***p<0.001, ****p<0.0001.

