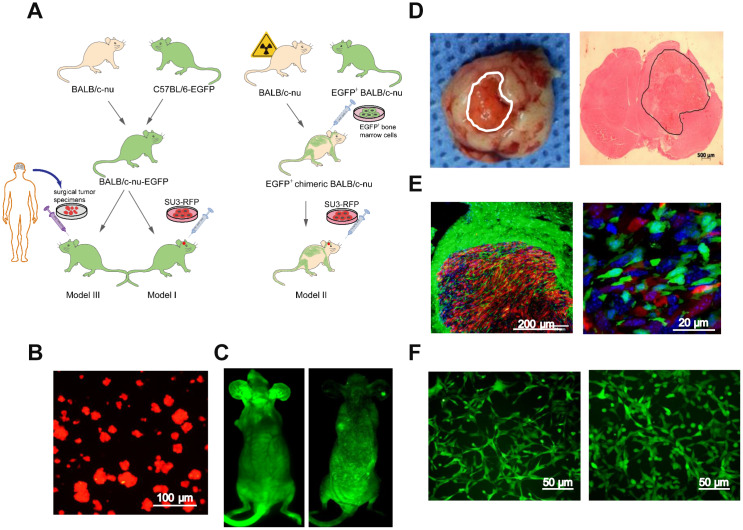
Figure 2.
Intracerebral xenografting of GSCs. (A) Schematic overview of the establishment of the dual-color fluorescence-tracing intracranial GSC-MSC interaction model; (B) SU3-RFP cells; (C) Transgenic EGFP+ nude mouse, and chimeric nude mice with autologous bone marrow deprivation and exogenous EGFP+ bone marrow cell transplantation; (D) Transplanted tumor observed under natural light, and H&E staining of a transplanted tumor section; (E) Transplanted tumor from an EGFP+ nude mouse under a fluorescence microscope; (F) Monocloned EGFP+ cells with high proliferative capacities, TMEC1, TMEC2. Scale bars: (A) 100 μm; (C) 500 μm; (D) 200 μm; (F) 50 μm.

