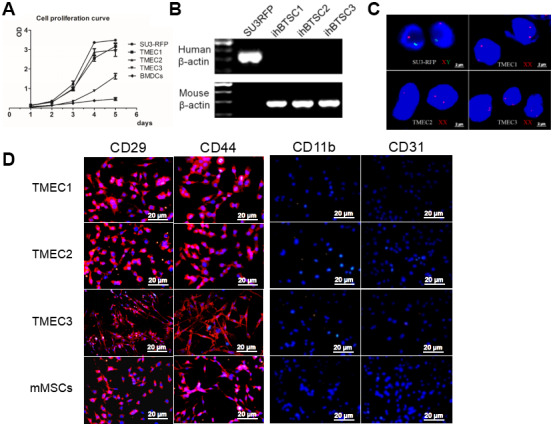
Figure 4.

Transformation of host stromal cells. (A) Cell proliferation curve; (B) RT-PCR analysis of human and mouse β-actin expression in SU3 cells and three TMEC lines; (C) FISH assay of chromosomes in SU3 cells and transformed cells; (D) Immunofluorescence of the three tMSC lines. Scale bars: (C) 2 μm; (D) 20 μm.
