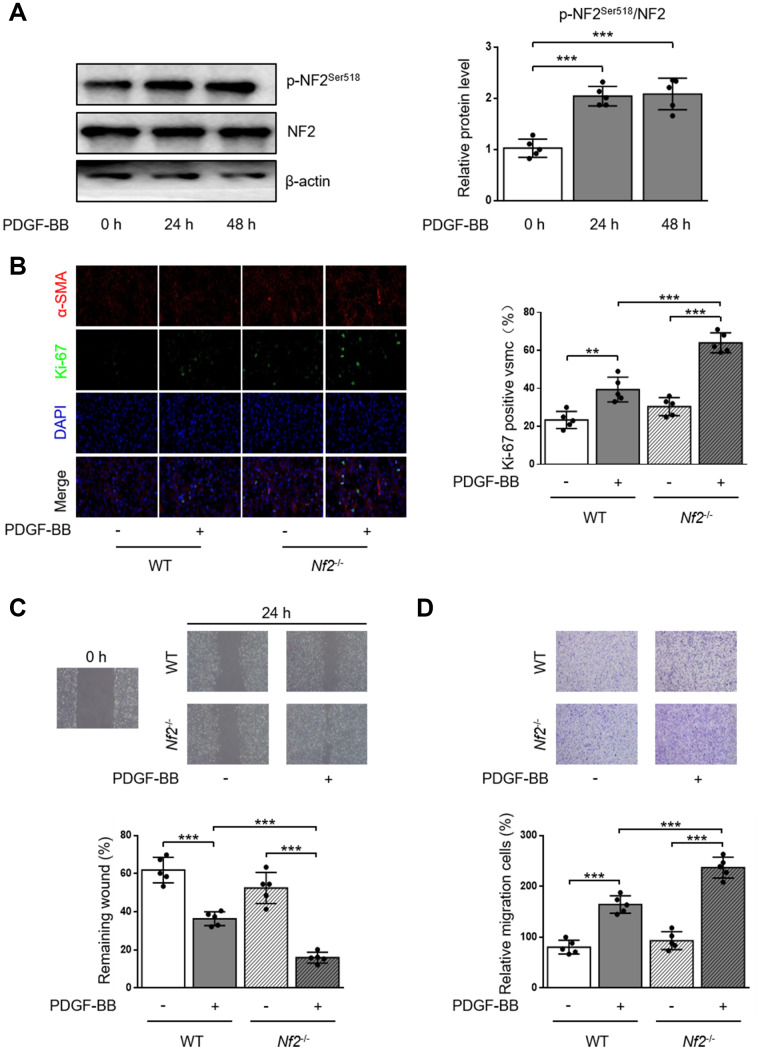
Figure 2.
VSMC proliferation and migration in vitro is elevated after NF2 knockdown. (A) The relative protein expression levels of p-NF2Ser518 and NF2 were determined by immunoblotting in VSMC after 0, 24 and 48 h of physiological saline or PDGF-BB (30 ng/mL) treatment (n=5). (B) VSMC isolated from WT or Nf2-/- mice was stained with SM α-actin (red), Ki-67 (green) and DAPI (blue) after 48 h of physiological saline or PDGF-BB (30 ng/mL) treatment. Representative images (left) and corresponding quantification of Ki-67 positive VSMC (right) were shown (n=5). Magnification 400×. (C) Migration of VSMC isolated from WT and Nf2-/- mice after 24 h of physiological saline or PDGF-BB (30 ng/mL) treatment was measured via wound healing assay. Representative images (upper panel) and corresponding quantification of healing rates (lower panel) were shown (n=5). Magnification 100×. (D) VSMC isolated from WT or Nf2-/- mice after 8 h of physiological saline or PDGF-BB (30 ng/mL) treatment was assessed by transwell assay. Representative images (upper panel) and corresponding quantification of migration cells (lower panel) were shown (n=5). Magnification 100×. Data are shown as mean ± S.D. **P<0.01 and ***P<0.001 denote statistical comparison between the two marked groups, respectively.

