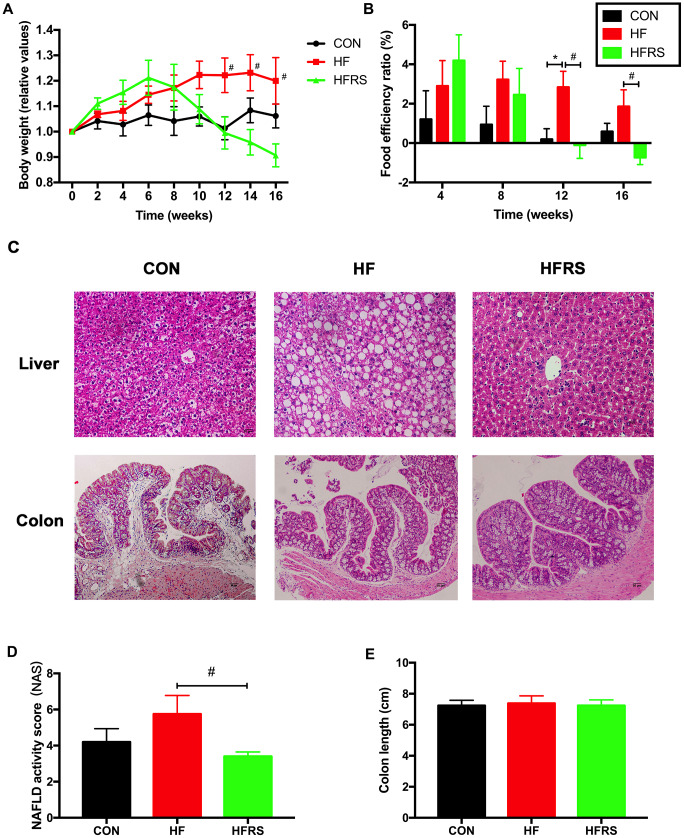
Figure 1.
RS2 reduced body weight gain and liver NAFLD activity score in aged mice on high-fat diet. (A) Effects of diets on relative values of body weight every two weeks. (B) Monthly food efficiency ratio among the three groups. (C) Liver and colon histology on H&E staining slides (magnification, 200X) among the three groups. (D) Comparison of NAFLD activity scores calculated by the average score of three fields in each H&E staining slides (magnification, 400X). (E) Comparison of colon length among the three groups. n=5 or 6/group. Data are expressed as mean+SE. Differences were compared by one-way ANOVA among the three groups with Tukey’s multiple comparison posttests between the two groups. * p<0.05 compared with CON group, # p<0.05 compared with HFRS group. CON, control group; HF, high-fat diet group; HFRS, high-fat diet+20%RS2 group.

