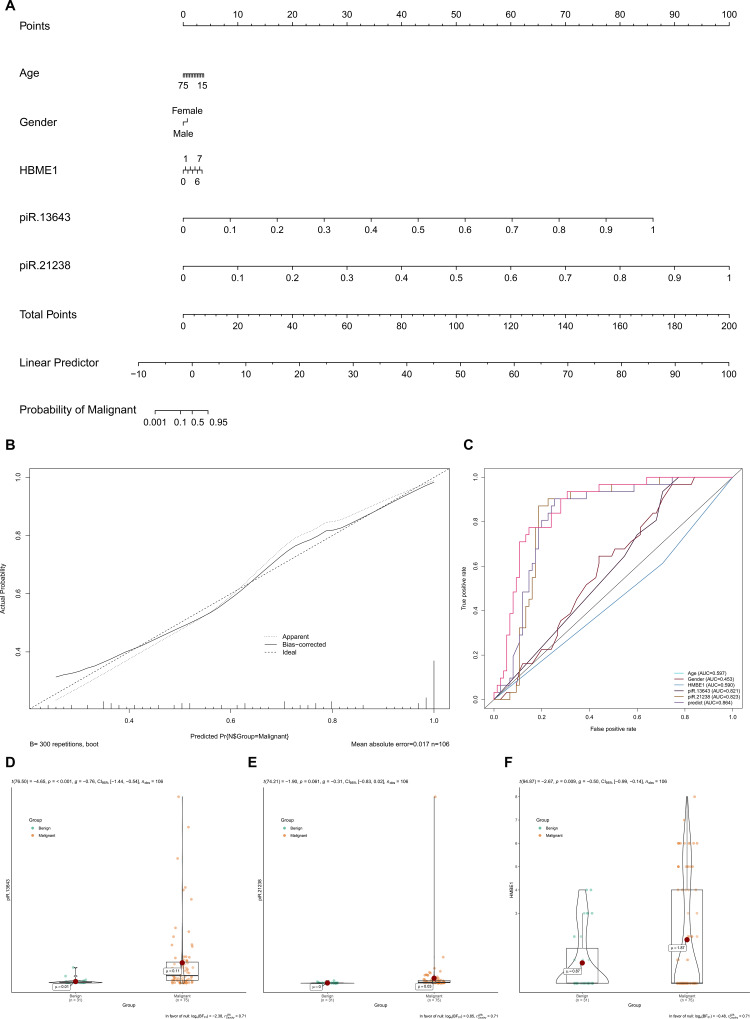
Figure 6.
The expression levels of key piRNAs were corrected by demographic data to construct a multivariate model to distinguish malignant nodules from benign. (A) Nomogram based on multivariate model (A). The calibration curve and ROC curves suggested acceptable calibration (B) and discrimination (C) of the nomogram, respectively. Additionally, piR-13643 (P < 0.001), piR-21238 (P = 0.061) and HBME1 (P = 0.009) were higher in malignant nodules compared to benign nodules in both fresh and paraffin samples (D–F).

