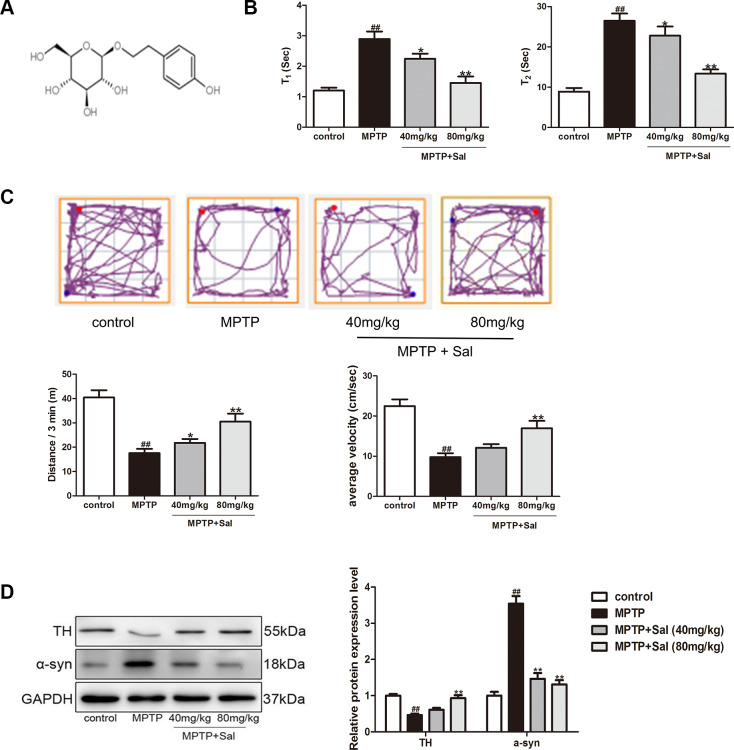
Figure 1.
Sal improved MPTP-induced PD mice. (A) The structure of Sal. (B) The performance of Pole test in MPTP-induced mice. The time for mice to turn from upward to downward (T1) and to climb down the pole (T2) was determined (n = 10). (C) The track of mice treated with MPTP with or without Sal, 3 min total traveled distance (Distance/3 min) and average velocity (average velocity / 3 min) (n = 10). (D) Western blotting was performed to determine the expression of TH and α-syn in Substantia nigra (SN) and striatum of PD mice (n = 3). All data are represented as mean ± SD. # P < 0.05, ## P < 0.01 vs. control group, *P < 0.05, **P < 0.01 vs MPTP group.

