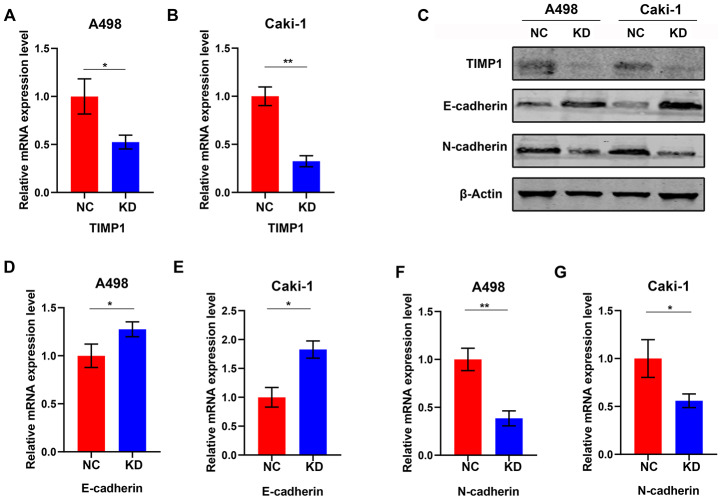
Figure 7.
Knockdown of TIMP1 induced MET in A498 and Caki-1 cells. qRT-PCR (A, B) analysis of TIMP1 expression in A498 and Caki-1 cells transfected with TIMP1 shRNA (KD) and normal controls (NC). (C) Western blot analysis of TIMP1 expression in A498 and Caki-1 cells transfected with TIMP1 shRNA (KD) from a normal control (NC). Expression levels of protein (C) and mRNA (D–G) of the EMT markers are shown. (* p<0.05, ** p<0.01, *** p<0.001 by t-test).

