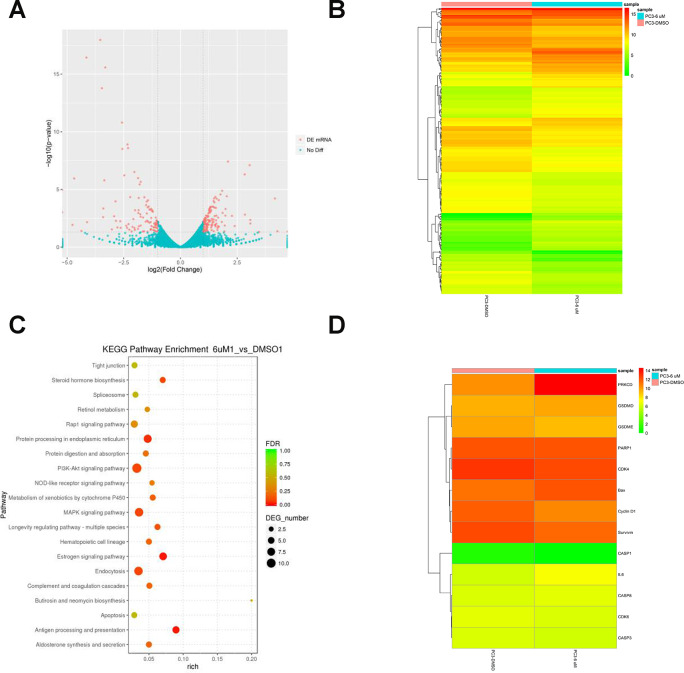
Figure 2.
RNA-Seq analysis of overall transcriptomic changes in C10-treated PC3 cells. (A) The differentially expressed genes were redacted and visualized as a volcano plot. The red dots represent significantly differentially expressed genes, while the blue dots indicate non-significantly differentially expressed genes. (B) Heatmap of genes upregulated or downregulated by C10 treatment in PC3 cells. (C) KEGG enrichment analysis of signaling pathways altered by C10 treatment. The color and size of the dots indicate the significance of the false discovery rate and the number of differentially expressed genes in the pathway, respectively. The top 20 significantly enriched signaling pathways were profiled. (D) The dysregulated genes involved in the cell cycle, apoptosis and pyroptosis were screened from all the raw data, compiled into a new list and shown as a heatmap.

