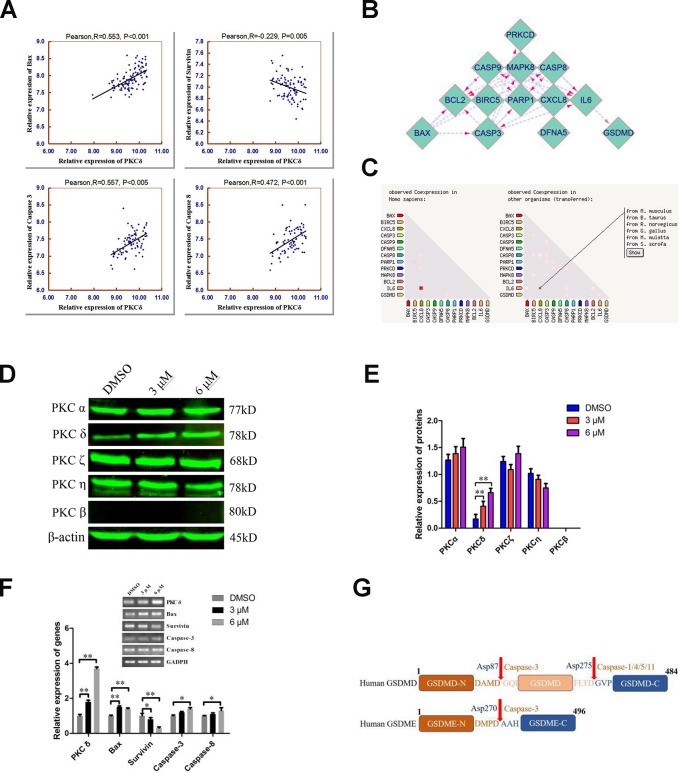
Figure 5.
Combined analyses of the Taylor and STRING databases to predict the correlation between the levels of PKCδ and other core genes in pyroptotic events. (A) Plots of significant Pearson’s correlations between PKCδ levels and Bax, Survivin, Caspase-3 and Caspase-8 levels in the PCa dataset are shown. R is Pearson’s correlation coefficient, and the x and y axes denote the respective genes being analyzed. Data were obtained from the Gene Expression Omnibus. (B, C) Bioinformatics analysis of PPI and co-expression data in Homo sapiens from the STRING database, visualized using Cytoscape 3.7.1. (D, E) Western blot showing the expression of different PKC subtypes in PC3 cells treated with C10 for 24 h. (F) The mRNA levels of PKCδ, Bax, Survivin, Caspase-3 and Caspase-8 were measured by qRT-PCR in PC3 cells treated with C10 for 12 h. All data shown are representative of three independent experiments. Data are shown as the mean ± SD. *P < 0.05, **P < 0.01 vs. the control group. (G) Diagrams of the human GSDMD and GSDME proteins. Red arrows indicate the cleavage sites of Caspases.

