
Figure 1. Label-to-label distance distributions reveal backbone disorder.
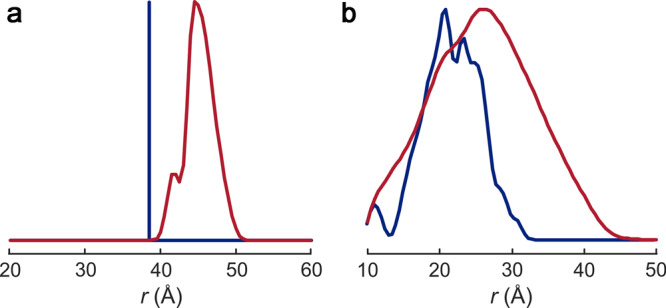
(a) Distribution of the Cα–Cα backbone distance rαα (blue) and the label-to-label distance ree (red) for residue pair 96/143 in the rigid core of plant light-harvesting complex LHCII. The width of P(ree) is well below 10 Å. (b) Distributions for residue pair 3/34 in the flexible N-terminal domain. Label-induced broadening is enhanced by the variation of side chain orientations of disordered residue 3. The width of P(ree) is well above 10 Å. The distributions were simulated in MMM [26] based on PDB structure 2BHW and the restraints reported in [53].